

Determining the Optimum Replacement Schedule for Commercial Layers: Does Moulting Pay Off?
Modelling the economic implications of forced moulting laying hens by R. Schulte-Drüggelte and H-H. Thiele of Lohmann Tierzucht GmbH in Cuxhaven, Germany in the April 2013 edition of 'Lohmann Information'.Introduction
Within given constraints, management decisions focus on overall profitability of the business. The profit from egg production for a farm or a specific flock of laying hens depends on many variables, including:
- market preferences for different egg size and management conditions
- availability of suitable rearing conditions
- disease control and nutrition throughout the life cycle
- pullet and spent hen prices
- seasonal variation in egg prices and
- genetic potential of a given strain of laying hens.
Historically, most flocks were housed annually, and egg production followed seasonal cycles. In Europe, most chicks used to hatch early in the year, and the custom of eating eggs ‘ad libitum’ at Easter helped to utilize surplus production at peak rate of lay, while eggs were short in supply late in the year, when most hens went into a natural moult and winter pause.
Since the introduction of lighting programmes, chicks can hatch throughout the year, and eggs can be produced to meet any demand. Today’s commercial layers have the genetic potential to maintain high egg production and acceptable shell quality for more than 12 months, and producers can vary their placement schedules to maximise egg income over cost, depending on seasonal price cycles, preferences of retail chains and specific customer demand in niche markets.
The optimum length of a laying period has been the subject of many studies for more than 50 years and mathematical tools were developed to determine the optimum under defined assumptions (White, 1959; Yassin et al., 2012). Kühne and Flock (1978) compared weekly egg production records of an early maturing strain with one that matures later to demonstrate substantial differences in lifetime profitability if the choice of strain is combined with the strain-specific optimum length of laying period. The theoretically ‘optimal’ replacement schedule calls for keeping the current flock in production as long as its weekly contribution margin exceeds the expected average weekly contribution margin of a new flock. However, these model calculations ignore seasonal variation in monthly egg income, which may be important if these effects are predictable.
Since the study of Kühne and Flock (1978), the persistency of egg production and shell strength has been significantly improved in modern strains of laying hens and more computerisd data are available on daily feed intake in environment controlled egg production units. Bell (2012) recently analysed and commented the performance of LSL Lite flocks under US conditions, focusing on the variance between flocks during the first laying cycle up to 60 weeks of age, when many egg producers in the US traditionally moult their flocks. In the current analysis we will focus on factors determining the optimum length of the laying period and answer the question whether it pays off to moult LSL Lite layers.
The authors answer this question by annualising the contribution margin of flocks housed for one and two cycles.
Results
The final report of the 38th North Carolina layer performance and management test (Anderson, 2012) includes valuable information on the question of moulting under US conditions. This 83-page report contains 64 tables and 19 graphs with detailed results from 11 white-egg and seven brown-egg strains, housed at different densities and exposed to different management alternatives.
Table 1 shows the average egg income minus feed cost for all white-egg and all brown-egg entries across two cage densities; results for a control line are also shown as a measure of genetic progress.
| Table 1. Egg income over feed cost (IOFC) per hen housed depending on the length of the laying period and after non-anorexic moulting | ||||
|---|---|---|---|---|
| Strain of layers | 119–483 days | 119–595 days | 119–763 days | Not moulted |
| All 11 white | 14.37 | 20.24 | 20.42 | 22.76 |
| All 7 brown | 13.18 | 17.17 | 18.46 | 20.42 |
| BPR control | 2.88 | 3.32 | 1.34 | n.a |
| Source: Adapted from Anderson, 2012 | ||||
The results in this table suggest what is widely accepted in the US egg industry: the egg income over feed cost is higher if the hens are either kept beyond 12 months of lay in a single cycle (68 instead of 52 weeks), or kept for a second cycle after a non-anorexic moult at 69 weeks of age (instead of keeping the hens to 109 weeks of age without moulting).
But this is only half of the story and tells us little about be optimum placement schedule unless we convert the IOFC figures from table 1 to annual production. These results are shown in Table 2 and will probably surprise egg producers who are convinced that recycling is good business for them.
| Table 2. Annual income over feed cost (IOFC) per hen housed depending on the length of the laying period and after non-anorexic moulting | ||||
|---|---|---|---|---|
| Strain of layers | 119–483 days | 119–595 days | 119–763 days | Not moulted |
| All 11 white | 14.37 | 15.52 | 11.57 | 12.90 |
| All 7 brown | 13.18 | 13.17 | 10.46 | 11.57 |
| BPR control | 2.88 | 2.55 | 0.76 | n.a. |
| Source: Adapted from Anderson, 2012 | ||||
If a single cycle to 85 weeks (595 days) of age were close to the optimum, we should not expect good business people to prefer recycling. Have we overlooked something? In order to get a more realistic estimate of maximum annual IOFC we have to take weekly egg income and feed cost into account.
In the following calculations, we will use the standard for LSL Lite in North America. The input parameters and conclusions may differ for other strains. Egg income is calculated from the weekly rate of lay, percentage of second grade eggs, average egg weight and the corresponding percentage of eggs in the different size categories according to the breed standard for LSL-Lite in North America (LTZ, 2012) and egg prices according to Table 3; spent hens are assumed to have no market value.
| Table 3. Egg grades, size categories and US prices | |||
|---|---|---|---|
| Grade | Size | Size category (grams per egg) | Price cent per egg |
| A | Extra Large | >64 | 9.92 |
| A | Large | 56–64 | 9.67 |
| A | Medium | 50–56 | 7.75 |
| A | Small | 42–50 | 6.58 |
| A | Pee Wee | <42 | 3.25 |
| B | All | All | 80 cent per kg |
| Source: Adapted from Anderson, 2012 | |||
Weekly feed costs are calculated from the breed standard for daily feed consumption and a fixed price of US$350 per ton, similar to the average feed price during the first cycle in the North Carolina test.
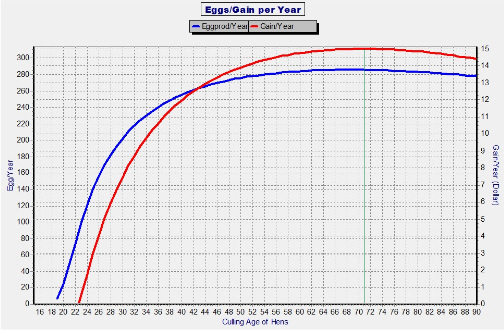
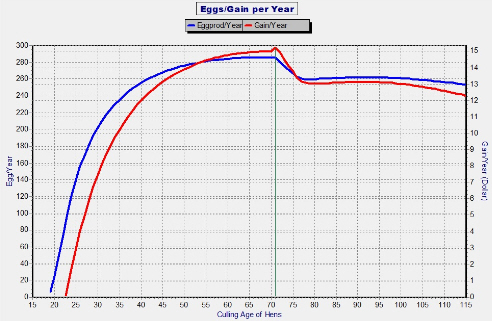
Which length of laying period would these calculations suggest as optimum to maximize annual IOFC? Figure 1 suggests a maximum of approx. 15 $ per hen place and year if the flock is terminated at about 71 weeks of age. However, this is not yet the optimum replacement schedule
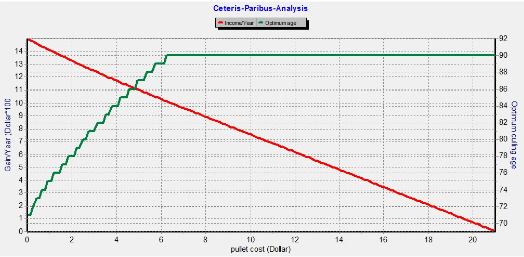
To get closer to the optimum replacement schedule, we have to take pullet cost into account. Other variable costs like labour, energy, water or veterinary costs will reduce the contribution margin, but are negligible in terms of the optimum length of laying period. We assume four weeks down-time between flocks, without considering extra cleaning costs.
Figure 2 shows the general effect of pullet price on optimal replacement schedule, with pullet prices exceeding the range found in practice. Obviously, high pullet prices (or shortage of pullet rearing facilities) will be a strong argument for a longer laying period. Assuming a pullet price of $5, annual egg income over feed and pullet cost would be optimized at a culling age of 86 weeks.
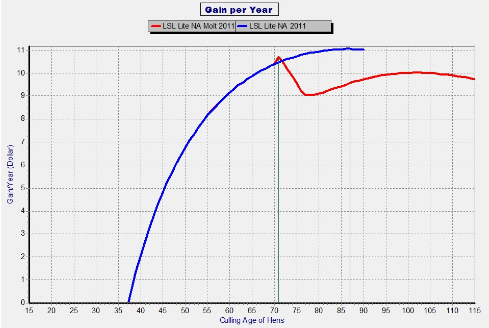
So far, we only considered housing for a single cycle up to 90 weeks of age. Figure 4 shows the results of IOFC optimisation allowing a second cycle up to a total age of 115 weeks based on the performance standard shown in Figure 3.
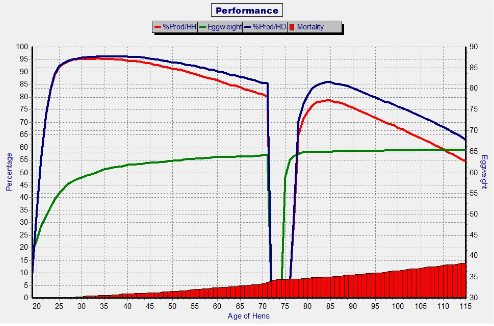
Figure 4 only shows that it would not make sense to moult if pullet cost could be ignored. Figure 5 shows what happens if a pullet price of $5 is included in the calculations. The egg income minus feed and pullet costs reaches a second peak after the moult, with a rather flat top of the curve around 105 weeks of age. However, this second peak is one dollar lower than the optimum for a single cycle to 86 weeks of age.
The results of our model calculations show that LSL-Lite hens may reach an optimum in a single cycle around 85-90 weeks of age or a somewhat lower annual egg income over feed and pullet costs around 100-105 weeks of age. Despite the economic advantage of single cycle production demonstrated in Figure 5, recycling flocks may be preferred as a means to increase average egg weight. The expected differences in grading results are shown in Table 4. A predictable demand for extra large eggs at a premium price may justify moulting.
Summary and Conclusions
When we published results of our first analysis on optimal length of laying cycles, under conditions of the German egg market 25 years ago, considering only a single cycle, it was concluded that about DM1 per hen place per year more could be earned if a strain with persistent production were kept for an extended laying period. Since then, the persistency of egg production has been further increased, and we extended the question to include moulting as a possibility. The authors’ calculations are based on a defined set of assumptions.
When results from the North Carolina Management Test were converted from life time egg income over feed cost (Table 1) to annual figures (Table 2), a significant advantage of a long single cycle to 85 (instead of 72) weeks was apparent for white-egg layers, but not for brown-egg layers. Moulting did not improve annual IOFC per hen place.
The question of optimum placement schedules with one or two cycles was further analysed, including pullet costs, based on US egg and feed prices and performance standards for LSL Lite hens in North America. The final results are shown in Figure 5 and Table 4: a single cycle to about 85 weeks of age can increase annual egg income over pullet and feed cost by about $2, compared to about 105 weeks of age after moulting.
| Table 4. Calculated percentage of eggs in different size categories depending on culling age | |||
|---|---|---|---|
| Size | Size category (grams per egg) | Single cycle up to 85 weeks | Two cycles up to 109 weeks |
| Extra Large | >64 | 34.3% | 40.2% |
| Large | 56–64 | 50.6% | 47.3% |
| Medium | 50–56 | 11.4% | 9.5% |
| Small | 42–50 | 3.3% | 2.6% |
| Pee Wee | <42 | 0.3% | 0.3% |
Results for other strains (especially less persistent or brown-egg strains) may differ. Moulting can be economical if pullet prices are high and/or premium prices are paid for large eggs.
For further information from Lohmann Tierzucht, click here.
References
Anderson K. 2012. Final Report of the 38th North Carolina Layer Performance and Management Test. NC State University, Cooperative Extension Service.
Bell D. 2012. US Experiences with Lohmann Selected Leghorn (LSL-Lite) Layers. Part 4: Economic Evaluation of Flock Performance. Lohmann Information 47(2): 34-40.
Kühne W. and D.K. Flock. 1978. Bestimmung der optimalen Haltungsdauer von Legehennen in Abhängigkeit vom Verlauf der Produktionskurve und anderen Einflüssen. Lohmann Information Mai/Juni 1978: 1-10.
LTZ (2012): Management Guide Layers. Lohmann LSL-Lite North American Edition.
White W.C. 1959. The Determination of an Optimal Replacement Policy for a Continually Operating Egg Production Enterprise. Am. J. Agr. Econ. (1959) 41(5): 1535-1542.
Yassin, H., Velthuis A.G.J., Giesen G.W.J. and Oude Lansink, A.G.J.M. 2012. A model for an economically optimal replacement of a breeder flock. Poultry Science 91:3271-3279.
May 2013


