

Long Term Meat Production and Consumption Trends
By John Lawrence - We often spend a lot of time focusing on short term market situation and outlook. These quarter-to-quarter and year-to-year supply and price forecasts are important for business planning. It is also important to step back and take a longer term perspective on occasion, not only where we have been but what factors will carry us forward.
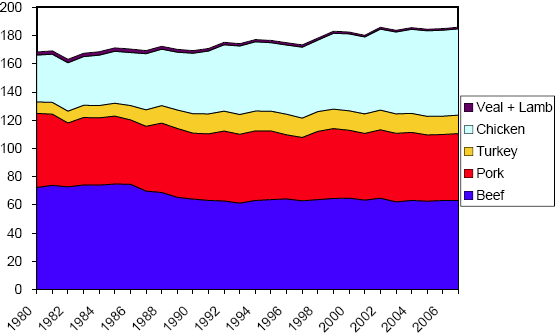
Figure 1 is a graph of US per capita red meat and poultry consumption for 1980 to 2007. The 2006 and 2007 forecast are from USDA and do not show much change from 2005 levels. Per capita red meat and poultry consumption has increased 8% between 1980 and 2005 and now stands at 187.5 pounds per person on a boneless equivalent basis. This amount is just over a half a pound a day. The increase is entirely from chicken (up 83%, 27.5 lbs.) and turkey (up 63%, 5.1 lbs) from 1980 while beef and pork consumption declined 13% (9.7 lbs) and 11% (5.6 lbs), respectively over the same period.
Boneless Equivalent (pounds/year)
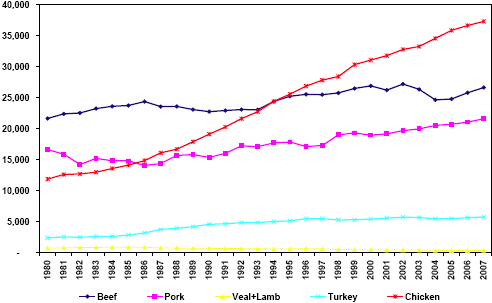
Consumption shown in Figure 1 is not measured, but rather calculated as production + imports – exports + inventory adjustments. Figure 2 shows the annual production on a carcass equivalent basis since 1980 through 2007. Notice that production of all categories, except veal and lamb, has increased. In particular, chicken production has increased dramatically. Beef and pork increased 15% and 25%, respectively from
1980 to 2005 while turkey and chicken increased 131% and 202%.
Chick production sets a new record every year, as has pork in recent years. Turkey production has been relatively stable. Beef production set a record in 2002 and is expected to be near that record by 2007.
(Carcass Equivalent, Million Pounds)
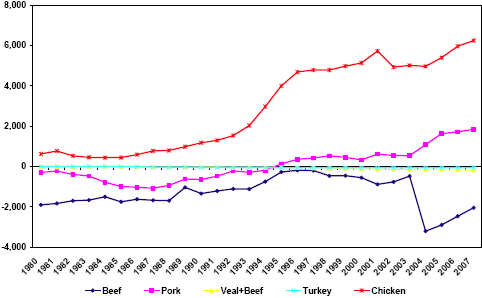
Comparing Figures 1 and 2 we see similar trends, but different relative changes. Part of the difference between categories is due to the boneless yield from a carcass for red meat versus poultry, but the major difference is due to trade. Figure 3 shows the net exports for the categories. Note that veal + lamb and turkey trade balance is small relative to the other categories. However, in the case of lamb, imports are
nearly equal to US production.
The US has been a net exporter of chicken through out the time period, and has exported more pounds of chicken that beef and pork combined each year since the early 1990s. Pork became a net exporter in 1995. The beef trade balance had been slightly negative on a volume basis until 2004 with exports were restricted because of BSE.
(Carcass Eqivalent, Million Pounds)
Looking Ahead
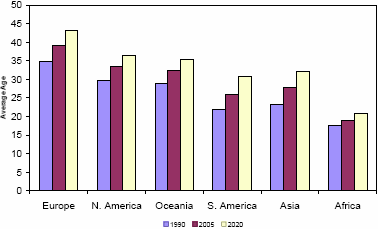
Demographics are important drivers of meat demand. Trends in population, age, and income in the US and export customer countries are reasonably predictable and have differing implications for the livestock and poultry sectors. More people require more food and, in general older populations tend to eat less meat than younger populations. We also have a lot of experience that meat consumption increases as economies move beyond subsistence levels of income.
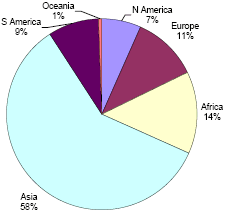
Asia has over half of the world’s population (Figure 4). Africa has the fastest population growth, but unless the economy of these countries can be improved, perhaps through agriculture, they will not have the income to buy US meat exports. South America and Asia have populations expected to grow 19% and 17%, respectively, by 2020 and have growing economies. North America, including Mexico, is growing more slowly than the developing economies and Europe’s population is expected to decline in 15 years.
Europe and North America have the most mature populations and economies. Consumers in these two regions are not likely to consume more meat as their income grows as we would expect to see in the developing economies. However, they will spend more on food in total meaning they are willing to spend more on convenience and quality not just calories. Thus, there will be opportunities for higher quality higher, priced products in the US, Canada, Europe, and other developed economies like Japan. However, but the growth of red meat and poultry industries focusing on commodity production depends on being globally competitive at producing safe wholesome and affordable products to serve growing populations and economies particularly in Asia and South America.
Source: John Lawrence, Iowa Farm Outlook - February 2006


