

Poultry Production in England
A Farm Business Survey by the University of Reading. This report is one of a series being produced based on the results of the Farm Business Survey (FBS) for England. The annual Farm Business Survey is the most comprehensive and independent survey of farm incomes and provides a definitive data source on the economic and physical performance of farm businesses in England. It is conducted by a Consortium comprising the Universities of Cambridge, Newcastle upon Tyne, Nottingham and Reading, and Askham Bryan, Duchy and Imperial Colleges. The Consortium is lead by the University of Nottingham and its members work in partnership, using uniform and standard practices in reporting on their findings to ensure consistent data quality, accuracy and validity.Summary
The UK poultry industry grew significantly over the last two decades, producing 174 million birds by 2005, with this growth largely due to a near doubling of the number of birds for meat production (broilers) in response to an increase in the per capita consumption of poultry meat. The number of laying hens declined over the same period, but increases in hen productivity have maintained egg production volumes.
Broiler production was distributed over 3,100 holdings in 2005, but the majority of these were relatively small scale and the bulk of production (69%) originated from the largest 400 holdings, which had flock sizes in excess of 100,000 birds. Egg production is similarly dominated by a small number of holdings, with the largest 1% of some 37,400 units generating 78% of output by volume.
UK poultry producers, which had farm gate sales of £1.6 billion in 2005, supplied 90% of domestic demand for poultry meat and 86% of demand for eggs. This rate of self sufficiency is high, although it has declined in recent years.
The poultry industry does not receive direct support under the CAP, but is one of the most regulated industries in UK agriculture and is subject to public hygiene and animal welfare codes which govern the way birds are housed, fed and transported. In 2005 the industry was still adjusting to new regulations introduced in 2002 (the Welfare of Laying Hens Directive), compliance with which, it is estimated, will cost the industry in excess of £400 millions by 2012. The broiler industry is likely to be faced with new regulation by 2010, as a result of agreement on an EC directive that will impact on producers of more than 500 birds.
The price of eggs has risen faster than the costs of production since 2000, but egg prices fell back in 2004, leading to a drop in gross output on laying holdings. This fall in revenues was offset, though only partially, by a fall in variable costs, resulting in a fall in average Net Farm Income (NFI) of 14.6% from 2004 to 2005. However, not all types of producers fared this badly and battery hen units, which tend to be larger than their free-range counterparts, experienced a 32% rise in NFI. Total liabilities for laying units increased by 19% in 2005, but this was offset by an increase in total assets, primarily due to increases in the value of land and buildings, resulting in a 4% increase in net worth, which in 2005 stood at an industry average of £322,532.
Poultry meat prices have risen only slowly since 2000 and have been outpaced by rises in the costs of production. In 2005 this trend continued, resulting in average gross output rising just 3% and variable costs rising 9%. In consequence, NFI for these holdings fell 25% on average. Total assets fell by 7.8% in 2005, but this was more than offset by a 29.7% fall in total external liabilities, particularly bank loans, resulting in a 5% increase in net worth.
Section 1: Commentary on the UK Poultry Section
1.1 General introduction
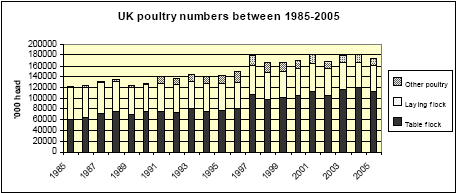
In 2005 the UK poultry industry produced in excess of 174 million birds (see Figure 1.1), around 64% of which were table chickens (produced for meat), while 28% were laying hens, with the remaining 8% being other poultry such as turkeys, ducks and geese. Although the total number of birds in the UK flock can vary significantly from year to year, the general trend over the last two decades has been one of increasing bird numbers, due to a near doubling of the number of table birds. The number of laying birds has declined by some 50% over the same period, as the productivity of laying hens has increased. As Figure 1.1 shows, there have also been significant increases in the number of other poultry.

Figure 1.1 UK poultry numbers between 1985-2005
Source: Defra (2007a)
1.2 The structure of the industry
1.2.1 Poultry for meat
According to the June Agricultural Census, there were a reported 3,100 broiler holdings in the UK in 2005. Table 1.1 shows how these units were distributed over size groups, where size is defined by the number of birds produced.
| Table 1.1 Distribution of broiler holdings and production volumes, by size group (2005) | ||||
| Flock size | Number of holdings | Total number of birds | ||
|---|---|---|---|---|
| (%) | (‘000) | (%) | ||
| 1 - 9,999 broilers | 2,000 | 64.5 | 668.2 | 0.6 |
| 10,000 - 99,999 | 700 | 22.6 | 33,848.1 | 30.4 |
| 100,000 and over | 400 | 12.9 | 76,970.5 | 69.0 |
| All | 3,100 | 111,486.8 | ||
| Percentages do not sum to 100 due to rounding errors. | ||||
| Source: Defra (2007b) | ||||
In terms of production volumes, the broiler industry is dominated by a relatively small number of producers, with 69% of all production concentrated on the largest 400 holdings (13% of holdings). It is not possible to give detailed evidence on longer-term trends in the number and size of broiler flocks in the UK because of changes to the representation of broiler holdings in the June Census from 1997. However, the data are sufficient to infer that average flock sizes have been increasing in the last decade. For example, in 1995 there were 200 holdings with broiler flocks in excess of 100,000 birds, but by 2005 this number had doubled.
A study by the University of Exeter in 2004 (Exeter, 2004) found that upwards of 70% of UK broiler production was processed by just 4 companies, who themselves produced half of all broilers on their own holdings. According to the Exeter study, in 2001, around 88% of broiler holdings employed a ‘conventional’ production system, with just 6% free range and 3% organic.
1.2.2 Poultry for eggs
There were 37,400 laying fowl holdings in the UK in 2005. Table 1.2 shows how these units were distributed over size groups, where size is defined by the number of birds produced. The laying fowl sector is even more heavily dominated by the largest producers than is the case for broilers with, in 2005, 78% of production arising from the largest 400 units, this representing just 1% of all holdings.
| Table 1.2 Distribution of laying fowl holdings and production volumes, by size group (2005) | ||||
| Flock size | Number of holdings | Total number of birds | ||
|---|---|---|---|---|
| (%) | (‘000) | (%) | ||
| 1 - 999 layers | 35,800 | 95.7 | 1,568.5 | 3.8 |
| 1,000 - 4,999 | 700 | 1.9 | 1,665.1 | 4.1 |
| 5,000 - 19,999 | 600 | 1.6 | 5,763.2 | 14.1 |
| 20,000 and over | 400 | 1.1 | 31,970.0 | 78.0 |
| All | 37,400 | 40,966.8 | ||
| Percentages do not sum to 100 due to rounding errors. | ||||
| Source: Defra (2007c) | ||||
Eggs are produced in three types of production system:
- Laying cages – the system consists of cages with sloping mesh floors allowing the eggs to roll forward out of reach of birds for collection. Cages may be stacked three high and are housed in environmentally controlled buildings many thousands at a time. This is the most common method of commercial egg production, accounting for 66% of eggs produced in 2004.
- Barn system – the system employs hen houses with a series of perches at different levels. Birds are allowed to roam the litter covered floor space, at a maximum density (since 2002) of 9 birds per square metre. This system accounts for around 7% of eggs.
- Free Range System – the system requires birds to have continuous daytime access to outdoor ‘runs’, covered with vegetation, to a maximum stocking density of 2,500 birds per hectare. Around 27% of eggs produced in the UK employ this system. Free range production can also be organic.
Producers sell eggs almost exclusively to packing stations, of which there were 1,509 in the UK, who handled 8,847 million eggs in 2005. The packers then sell on to a number of outlets. British Egg Information Service data for 2005 (BEIS, 2007) show that the relevant market shares of these outlets were: Retail (49%), Manufacturers/processors (for egg products) (28%) and Wholesale/caterers (23%).
1.3 Contribution of the sector to the economy
In 2006, total poultry output (meat and eggs) was valued at £1.6 billion at farm gate prices, with 21% of this, by value, accounted for by eggs (see Table 1.3). In the same year the poultry sector contributed some 11.3% of total agricultural outputs (excluding subsidy), this figure being some half of one percent lower than in the previous four years. The poultry industry receives no direct producer support payments under the Common Agricultural Policy.
| Table 1.3 Value of UK-produced poultry meat and eggs 2002-2006 (£M) | |||||
| 2002 | 2003 | 2004 | 2005 | 2006 | |
|---|---|---|---|---|---|
| Poultry meat | 1261 | 1343 | 1332 | 1302 | 1315 |
| Eggs | 314 | 337 | 380 | 350 | 357 |
| Total poultry | 1575 | 1680 | 1712 | 1652 | 1672 |
| Total agricultural output | 13357 | 14166 | 14400 | 14130 | 14737 |
| Source: Defra (2007d) | |||||
1.3.1 Poultry meat
The culinary versatility of poultry meat, particularly chicken, together with its perception as a ‘healthy’ meat option has, in recent times, driven an increase in the importance of poultry in the western diet. Recent statistics show that in the UK around 23kg of chicken are consumed per head per year, representing one third of total meat consumption. Retail sales of poultry meat in the UK are worth around £3.4 billion annually.
1.3.2 Eggs
In 2005, 10,116 million eggs were consumed in the UK (28 million per day), with a retail market value of £514 million, of which 86% were home produced. Around half of all eggs produced are sold retail as shell eggs, with the remainder split fairly evenly between processing/manufacturing and wholesale/catering.
1.4 Trade
The UK was 90% self-sufficient in poultry meat in 2005, although this represents a decline from around 97% in the late 1980s. As UK consumers tend to favour the premium cuts, a significant volume of the less favoured cuts, valued at £220M, are exported, as Table 1.4 shows. The UK was 86% self-sufficient in eggs in 2005, a decline from 94% in the mid 1990s.
| Table 1.4 Trade summary statistics – UK imports and exports of poultry and eggs in the 12 months to October 2006 | ||
|
Poultry for meat
|
||
|---|---|---|
| Imports (£M) | Exports (£M) | |
| Chicken | 855.8 | 180.9 |
| Duck | 25.6 | 8.2 |
| Goose | 5.9 | 0.1 |
| Turkey | 104.7 | 31.1 |
| Total meat | 992.0 | 220.4 |
| Eggs# | 77.1 | 27.5 |
| # Eggs trade data are for 2005. | ||
| Source: Poultry meat: British Poultry Council (2007); Eggs: Defra (2007e) | ||
1.5 Producer prices
1.5.1 Poultry meat prices
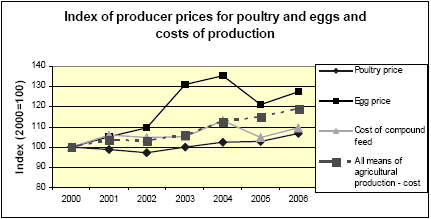
Poultry meat prices have been on a slight upward trend since 2002, but this trend has not kept pace with the costs of production (see Figure 1.2). Although the cost of compound feeds fell back in 2005, it rose sharply again in 2006. The total costs of production ended 2006 11 index points above poultry prices, implying that poultry margins have been increasingly squeezed since 2000.

Figure 1.2 Index of producer prices for poultry and eggs and costs of production
Source: Defra (2007f)
1.5.2 Egg prices
Egg prices have been more buoyant than poultry meat since 2000, rising to a peak in 2004, before falling back sharply in 2005. In 2006 prices picked up again to end the period ten index points above the cost of production, suggesting that egg producer margins remain relatively firm.
1.6 Animal welfare and regulation
The Poultry industry is heavily regulated in terms of public hygiene and animal welfare and successive welfare codes have been introduced which govern the way in which birds are housed, fed and transported. As a result, birds are raised across the industry in standardised and closely regulated environments (see Section 1.6.1 for a summary of existing and forthcoming legislation).
The industry is subject to routine testing and a State Veterinary Inspections programme in 2006 revealed that around 95% of all battery hen holdings were in full compliance with current animal welfare legislation. The picture is even better for broiler holdings, where close to 100% were fully compliant. The industry has its own Assured Chicken Production code and individual producers and supermarkets operate even higher standards.
At the present time the egg producing sector is still adjusting to new regulations introduced in the UK in 2002 (see Section 1.6.1), which will continue to add compliance costs to the industry until 2012, when the phasing-in period ends. The broiler industry is likely to be faced with new regulation by 2010, resulting from recent agreement on an EC directive that will impact on producers of more than 500 birds.
1.6.1 Regulation of and codes of conduct for poultry production
Laying hens
In 1999 the Welfare of Laying Hens Directive (1999/74/EC) (EC, 1999) was adopted and this was implemented in the UK by domestic legislation such as the Welfare of Farm Animals (England) (Amendment) Regulations 2002 (SI 2002 No. 16461) and by similar legislation from the Devolved Administrations. The legislation set out the following:
- Minimum standards for non-cage systems (barn, free-range). These came into effect on 1 January 2007.
- A ban on the barren battery cage from 2012. From 1 January 2003, no new barren battery cage systems may be brought into use, ‘enriched’ cages must be used instead.
- Minimum standards for “enriched” cages, including increased space allowance, a claw shortening device, perch, nest boxes and litter for scratching and pecking.
A Defra research exercise into the cost of compliance with these new regulations (see House of Commons, 2002) estimated one off costs for a medium sized flock of 100,000 birds at £1.39 millions and the cost for a flock of 400,000 birds of £5.57 millions. The total cost to the industry is estimated by the Defra study to be around £400 millions.
Broilers
Defra announced on 8 May 2007 (Defra, 2007h) that agreement had been reached on the contents of a EC directive to regulate the conditions in which chickens reared for meat are kept. The new measures include, amongst other things:
- The introduction of limits on stocking density
- A possible new welfare labelling regime
- Action against anyone breaking the rules
The directive will come into force by 2010 and will apply to all flocks of more than 500 birds. At present there is no dedicated legislation governing the production of poultry for meat, although a code of recommendations was published by Defra in 2002, based on elements of existing legislation governing the protection of farm animals (eg, The Welfare of Farmed Animals (England) Regulations 2000).
1.7 Avian Flu
The global spread of Avian Flu continued in 2006, placing the UK at increasing risk of infection from both migrating birds and from trade movements, both legal and illegal. In April 2006 there were two recorded outbreaks of Avian Flu in the UK. The first was the highly pathogenic H5N1 strain, found in a dead wild swan in Fife. This resulted in the enforcement, according to EC rules, of restrictions on poultry movements in the area, together with an extensive surveillance programme. Restrictions were lifted on 1 May 2006 and it was concluded that the swan came from outside the UK. The second outbreak was of the low pathogenic strain H7N3 at three commercial poultry holdings in Norfolk. Countermeasures prevented further spread and the restrictions were lifted about a month later.
July 2007


