

Air Issues Associated with Animal Agriculture: a North American Perspective
Academic experts have examined a large amount of data and provide analysis on a wide scope of issues, from greenhouse gas (GHG) emissions to the logistics of manure storage facilities, in this report for the US Council for Agricultural Science and Technology (CAST). Here, we cover the report abstract and the section on poultry production.Abstract
The purpose of this CAST Issue Paper is to go beyond the generalisations and accusations often associated with the air quality topic. Experts from six universities examine a large amount of data and focus their information and conclusions around the key livestock areas: swine, poultry, dairy and beef. Their critical analyses look at a wide scope of issues, from greenhouse gas (GHG) emissions to the logistics of manure storage facilities. The US Environmental Protection Agency (EPA) is increasing efforts to monitor emissions from agriculture, so further research is important for all parties involved, and this paper provides solid, science-based information.
Studies indicate that large livestock production facilities lower the value of residences within 4.8 kilometres (km; three miles) of the facility. Other economic studies also indicate, however, that the businesses increase economic activity in the county and state. For the greater good of the rural community, a compromise needs to be reached between the positive and negative impacts of livestock production facilities using a common-sense approach that considers both regulatory and market forces.
Air emissions attributed to animal agriculture consist of odorous and gaseous compounds as well as particulate matter associated with manure and animal management. While localised problems associated with odour tend to get highlighted, gaseous compounds having localised or regional impacts, such as ammonia, and global concerns, such as those attributed to GHG, are becoming huge regulatory issues.
This paper looks at some of the mitigation techniques being employed to decrease the effects of the aerial pollutants. The authors also examine the disparity between the results of the EPA’s estimations of GHG emissions and the findings of the Food and Agriculture Organization (FAO) of the United Nations.
A few of the many specific findings include: diet composition has a significant impact on emissions; mitigation methods, such as covering the manure storage surface, can greatly decrease odor emissions; and aeration of the storage basin or employing anaerobic digestion of the manure will also reduce the odour, but with higher costs. The much-quoted study entitled Livestock’s Long Shadow distinguishes between intensive and extensive livestock production; US production is intensive so it does not have the GHG emissions associated with poor feed quality and deforestation.
Poultry Housing and Manure Management Systems
Ammonia (NH3) is the major noxious gas in poultry operations, resulting from biological breakdown of uric acid in the feces. Prolonged exposure to aerial environment with elevated ammonia concentrations adversely affects bird health, e.g. respiratory system, and productivity, e.g. feed intake, body weight gain, egg production, feed conversion. The recommended indoor ammonia level for poultry housing has been less than 25ppm (MidWest Plan Service 1990; United Egg Producers 2010). Indoor ammonia generation and concentrations are largely affected by housing and manure management practices.
Broilers and turkeys (referred to as meat-type birds) are produced in littered floor systems. Most of the litter is typically reused (known as built-up litter) over multiple flocks of production, whereas the caked litter (wet, hardened surface layer) along the feed and water lines is removed with special equipment between the flocks. Some poultry producers may apply new bedding (top-dressing) following removal of the caked litter, whereas others opt not to, depending on the amount of litter in the house and availability and cost of bedding materials. An exception is with turkey brooding (less than five weeks of age), where old litter is completely removed and new bedding introduced for each flock. The removed litter from turkey brooder barns is placed in the grow-out barns used to raise the birds to market age. Depending on geographical location, the bedding materials used in broiler and turkey housing include rice hulls, wheat or rye hulls, sawdust or wood shavings, peanut shells, sand and, in some cases, chopped straw or corn stalks.
More than 95 per cent of the commercial egg production in North America uses cage systems, either high-rise (HR) or manure-belt (MB) housing systems. Hen manure in HR houses generally is stored in the lower level of the house for one year and removed as solid manure in the fall and applied to crop land, whereas manure in MB houses is removed daily to weekly into a separate storage or composting facility. As a result of in-house manure storage for the HR system versus frequent removal of manure in the MB system, the MB houses generally have much better indoor air quality and lower ammonia emissions than the HR houses. In addition to the two pre-dominant housing types (HR and MB), a small fraction of eggs (<5 per cent) is produced in cage-free (CF) systems. Due to the significantly lower stocking densities of birds, thus lower body heat generation in the CF systems, maintaining a balance of good air quality (low ammonia concentration) and comfortable barn temperature has proved to be challenging for the CF houses during cold weather (Green et al. 2009).
Typical Indoor Ammonia and Particulate Matter (PM) Concentrations
Figures 1 and 2 show examples of indoor ammonia concentrations found in commercial poultry production facilities during different production seasons. Compared to ammonia data, PM concentration data are more limited. Nevertheless, Figures 3 and 4 illustrate diurnal variations of PM in commercial broiler and turkey buildings in different production seasons. As shown by the data, ammonia and PM concentrations vary considerably throughout the day, especially during cool or cold weather, when there exist the diurnal variation of outside temperatures and hence building ventilation rates to maintain the desired indoor temperature.
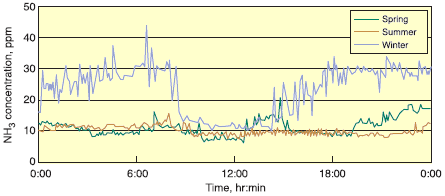
(Li, H. 2009. Personal communication)
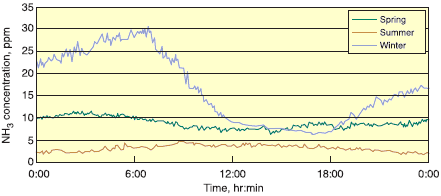
(Li et al. 2008a)
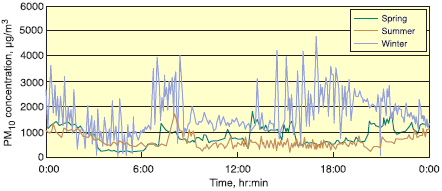
(Burns et al. 2008a)
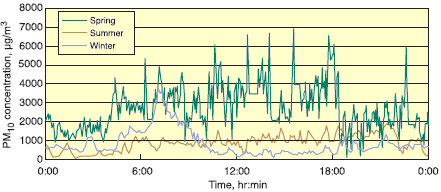
(Li et al. 2008a)
The ventilation rate in a poultry barn typically is controlled by indoor temperature but ventilation is the most commonly used method to decrease indoor ammonia concentration. Increased ventilation, however, usually comes with the price of increased energy costs for ventilation fan operation and fuel usage (primarily LP gas) when supplemental heating is required. Moreover, the decreased ammonia concentration does not represent decreased ammonia emission rates – the amount of aerial ammonia exhausted to the atmosphere. On the contrary, increased building ventilation rate likely leads to elevated emissions.
Outdoor (Downwind) Concentrations
Information concerning downwind gas or PM concentrations is meager for poultry operations.
The Iowa Department of Natural Resources conducted downwind monitoring at designated distances from AFOs (cattle, egg, and swine) and compared the results against certain human health effect values (HEVs) (hourly average of 30ppb hydrogen sulphide; H2S) and health effect standards (seven daily exceedances of the HEV per year) (IDNR n.d.). Fairchild (2008) reported ammonia concentrations downwind from tunnel-ventilated broiler houses, indicating that 94 per cent of the ammonia concentration readings were lower than 1ppm at 150 metres downwind from the exhaust fans.
Air Emissions from Poultry Facilities
Before 2000, air emissions data in the literature were collected mostly from European poultry production facilities. During the past six to eight years, in response to the recommendations from the previously mentioned 2003 National Academy of Sciences report, researchers in the United States have made considerable strides toward collecting baseline air emissions data for US production conditions. The most extensive field studies focusing on poultry air emissions completed to date are those reported by Liang and colleagues (2006) for ammonia and carbon dioxide (CO2) emissions from 10 laying-hen houses in Iowa and Pennsylvania over one year; by Wheeler and colleagues (2006) for ammonia and carbon dioxide emissions from 12 broiler houses in Kentucky and Pennsylvania over one year; and by Burns and colleagues (2008a,b) for ammonia, carbon dioxide, hydrogen sulphide (H2S), methane (CH4), nitrous oxide (N2O), TSP, PM10, and PM2.5 (PM with aerodynamic diameter of less than or equal to 2.5µm) from two broiler houses in Kentucky over one year.
Air Emissions from Poultry Houses
Table 2 summarises ammonia emissions for laying hen houses in different countries, whereas Table 3 summarises ammonia emissions from broiler and turkey houses in different parts of the United States. Compared to data on ammonia emissions, data on particulate matter emissions are more limited. Table 4 summarises the available literature information for poultry. Data on GHG emissions are even more limited. Burns and colleagues (2008b) reported GHG emissions of 3.41g methane (85.3 g carbon dioxide equivalents) and 1.72g nitrous oxide (513g carbon dioxide equivalents) per bird marketed for broiler houses in the southeastern United States. Compared to bird respiration of carbon dioxide production (4.64kg), carbon dioxide and nitrous oxide account for 9.8 per cent and 1.6 per cent of the total carbon dioxide equivalent emission, respectively.
| Table 2. Summary of ammonia emission rates (ER, g NH3/day/AU) of laying hen houses with different housing and management schemes in different countries (1 AU=500kg live weight) (Liang et al. 2006) |
||||
| Country | House Type (season) | Manure Removal | NH3 ER | Reference (Year) |
|---|---|---|---|---|
| England | Deep-pit (winter) | Info not available | 192 | Wathes et al. (1997) |
| England | Deep-pit (summer) | Info not available | 290 | Wathes et al. (1997) |
| England | Deep-pit (N/A) | Info not available | 239 | Nicholson, Chambers and Walker (2004) |
| USA (Ohio) | High-rise (March) | Annual | 523 | Keener, Elwell and Grande (2002) |
| USA (Ohio) | High-rise (July) | Annual | 417 | Keener, Elwell and Grande (2002) |
| USA (Iowa) | High-rise (all year) | Annual | 299 | Yang, Lorimor and Xin (2000) |
| USA (Iowa and Pennsylvania) | High-rise (all year) –standard diet |
Annual | 298 | Liang et al. (2006) |
| USA (Iowa) | High-rise (all year) –1 per cent lower CP diet |
Annual | 268 | Liang et al. (2006) |
| The Netherlands | Manure-belt (N/A) | Twice a week with no manure drying | 31 | Kroodsma, Scholten and Huis in’t Veld (1988) |
| The Netherlands | Manure-belt (N/A) | Once a week with manure drying | 28 | Kroodsma, Scholten and Huis in’t Veld (1988) |
| Denmark | Manure-belt (all year) | Info not available | 52 | Groot Koerkamp et al. (1998) |
| Germany | Manure-belt (all year) | Info not available | 14 | Groot Koerkamp et al. (1998) |
| The Netherlands | Manure-belt (all year) | Info not available | 39 | Groot Koerkamp et al. (1998) |
| England | Manure-belt (all year) | Weekly | 96 | Nicholson, Chambers and Walker (2004) |
| England | Manure-belt (all year) | Daily | 38 | Nicholson, Chambers and Walker (2004) |
| USA (Iowa) | Manure-belt (all year) | Daily with no manure drying | 17.5 | Liang et al. (2006) |
| USA (Pennsylvania) | Manure-belt (all year) | Twice a week with manure drying | 30.8 | Liang et al. (2006) |
| Table 3. Ammonia emissions of US commercial broiler and turkey houses | |||||
| State, USA | Species | Growth Period, d | Litter | g NH3/Bird Marketed | Reference (Year) |
|---|---|---|---|---|---|
| Tennessee | Broiler | 42 | Built-up | 38.6 | Burns et al. (2003) |
| Texas | Broiler | 49 | Built-up | 30.9 | Lacey, Redwine, and Parnell (2003) |
| Delaware | Broiler | 42 | Built-up | 49.6 | Seifert et al. (2004) |
| Kentucky and Pennsylvania | Broiler | 42 | New | 19.7 | Wheeler et al. (2006) |
| 42 | Built-up | 27.3 | |||
| 49 | Built-up | 37.2 | |||
| 63 | Built-up | 61.7 | |||
| Kentucky | Broiler | 52 | New | 25.5 | Burns et al. (2008a) |
| 52 | Built-up | 32.2 | |||
| Iowa | Tom turkey | 35–140 | New and built-up | 144±12 | Li et al. (2008a) |
| Minnesota | Hen turkey | 35–84 | New and built-up | 104±10 | Li et al. (2009) |
| Table 4. Summary of limited data on PM ER from poultry facilities in different countries (1 AU=500 kg live weight) | |||||
| Country | Poultry Species | Ventilation | PM Size | ER (mg/h/AU) | Reference (Year) |
|---|---|---|---|---|---|
| England | Broilers | Mechanical | Inhalable; respirable | 6,218; 706 | Takai et al. (1998) |
| Holland | 4,984; 725 | ||||
| Denmark | 1,856; 245 | ||||
| Germany | 2,805; 394 | ||||
| USA (Minnesota) | Turkey | Natural | PM10 | 135~210 (W) | Schmidt, Jacobson, and Janni (2002) |
| 431~2,133 (SU) | |||||
| USA (Texas) | Broiler | Mechanical/Mixed | PM10 | 536 | Lacey, Redwine, and Parnell (2003) |
| TSP | 10,210 | ||||
| USA (Indiana) | Layer | Mechanical | PM2.5 | 26 | Lim et al. (2003) |
| PM10 | 384 | ||||
| TSP | 1,512 | ||||
| USA (Ohio) | Layer | Mechanical | PM10 | 361~1,319 | Zhao et al. (2005) |
| TSP | 1,292~3,778 g/Bird Marketed |
||||
| USA (Kentucky) | Straight-run broiler grown to 52 d or 2.73 kg | Mechanical | PM2.5 | 0.25 (±0.02) | Burns et al. (2008a) |
| PM10 | 2.52 (±0.46) | ||||
| TSP | 6.0 (±0.29) | ||||
| USA (Iowa) | Tom turkey (35 to 140 d at 19.1 kg) | Mechanical | PM2.5 | 3.7 (±0.8) | Li et al. (2008a) |
| PM10 | 30 (±4) | ||||
| USA (Minnesota) | Hen turkey (35 to 84 d at 6.8 kg) | Mechanical | PM10 | 5.0 (±2.6) | Li et al. (2009) |
Air Emissions from Poultry Manure Storage
Manure-belt housing systems involve separate manure storage, which also contributes to the overall air emissions of the production system. Li and Xin (2010) reported lab-scale measurements of ammonia, methane and nitrous oxide emissions from hen manure storage. Factors considered in the evaluation included manure stacking configuration, manure moisture content (MC) as encountered under commercial production conditions, and ambient air temperature in the storage. Hen manure at 77 per cent MC emits more ammonia than that at 50 per cent MC (Figure 5). It should be noted that storage conditions under commercial settings can differ considerably from the controlled environment of the lab studies, and field measurements over extended periods are thus warranted.
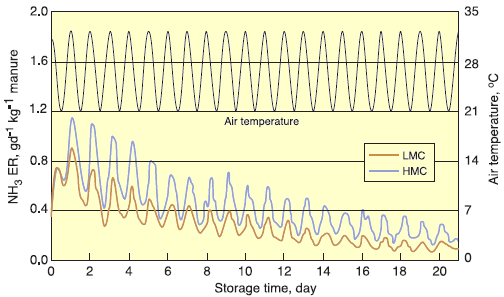
(Li and Xin 2010)
Air Emissions from Poultry Manure Land Application
Poultry manure is typically land applied as fertilizer, although poultry litter has found very limited use in renewable energy generation as a fuel in power plants. Data on air emissions associated with land application of poultry manure are much more limited when compared to emissions from poultry houses or manure storage due to technical difficulties in quantifying such emissions and inherent large variations of application conditions. Ammonia nitrogen loss from manure during land application has been expressed as a percentage of manure nitrogen content. These losses have been estimated to be seven per cent for dry laying-hen manure (Lockyer and Pain 1989), 41.5 per cent for wet laying-hen manure (Lockyer and Pain 1989) and 25.1 per cent for broiler litter (Cabera et al. 1994), as cited by the EPA in development of livestock and poultry manure management training.
Mitigation Technologies
To improve indoor air quality and decrease air emissions, researchers and others have been actively investigating viable techniques that will decrease the generation and/or emissions of the aerial pollutants. The mitigation techniques that have been studied include dietary manipulation (Roberts et al. 2007; Xin, H. 2010. Personal communication), topical application of chemical or mineral additives on poultry manure (Li et al. 2008b), electrostatic precipitation of particulates (Ritz et al. 2008), treatment of exhaust air via biofilter or wet scrubber (Bandekar, Bajwa, and Liang 2008; Manuzon et al. 2007; Melse and Ogink 2005; Shah et al. 2008), or vegetative environmental buffer (Malone, VanWicklen, and Collier 2008), as well as prompt incorporation of land-applied manure.
Although these prospective mitigation strategies have shown appreciable efficacy in emissions reduction, the economic viability of the techniques under production conditions remains to be further evaluated.
Further Reading
| - | You can view the full report from CAST, including the reference list, by clicking here. |
June 2011


