

GLOBAL POULTRY TRENDS 2014: Europe Expands Its Share of World Chicken Output
Europe's share of global broiler meat production is forecast to rise to 17 per cent this year. Industry analyst, Terry Evans, continues his review of the world chicken meat industry with a look at production trends in Europe, an area that includes Russia and Ukraine as well as the European Union.Chicken meat production in Europe over the period 2000 to 2012 grew by some 4.3 per cent per year compared with the global average of 3.9 per cent. Hence, Europe’s contribution to world output increased from 15.9 per cent to 16.6 per cent and could exceed 17 per cent in 2014.
The number of table birds plus culled layers birds slaughtered in Europe climbed by 2,904 million (42 per cent) from 6,881 million to 9,785 million, according to the Food and Agriculture Organisation (FAO). However, while those killed in the European Union increased by just 759 million (13 per cent) from 5,979 million to 6,738 million, the rise in the non-EU European countries was a massive 2,145 million (238 per cent) from 902 million to 3,047 million! The average eviscerated weight per bird went up from 1.35kg in 2000 to 1.58kg in 2012.
Chicken meat output in Europe, rose by 6.1 million tonnes (66 per cent) between 2000 and 2012 from 9.3 million tonnes to 15.4 million tonnes, while the world total went up by more than 34 million tonnes (59 per cent) from 58.5 million tonnes to 92.7 million tonnes (Table 1). Forecasts to 2014 envisage European output rising to around 16.5 million tonnes against 95.8 million tonnes for the global total.
| Table 1. Chicken meat production (million tonnes) | |||||||||||
| Region | 2000 | 2005 | 2006 | 2007 | 2008 | 2009 | 2010 | 2011 | 2012 | 2013E | 2014F |
|---|---|---|---|---|---|---|---|---|---|---|---|
| Indigenous chicken meat production*: | |||||||||||
| Africa | 2.8 | 3.3 | 3.4 | 3.7 | 4.0 | 4.2 | 4.5 | 4.6 | 4.6 | 4.7 | 4.7 |
| Americas | 27.1 | 32.7 | 33.7 | 35.0 | 37.5 | 36.9 | 38.6 | 39.8 | 40.1 | 40.6 | 41.3 |
| Asia | 18.6 | 22.4 | 23.5 | 25.0 | 26.2 | 28.0 | 29.2 | 29.9 | 31.4 | 31.8 | 32.1 |
| Europe | 9.3 | 10.9 | 10.8 | 11.6 | 12.1 | 13.3 | 13.9 | 14.6 | 15.4 | 15.9 | 16.5 |
| Oceania | 0.7 | 0.9 | 1.0 | 1.0 | 1.0 | 1.0 | 1.1 | 1.2 | 1.2 | 1.2 | 1.2 |
| WORLD | 58.5 | 70.2 | 72.3 | 76.2 | 80.7 | 83.4 | 87.3 | 90.1 | 92.7 | 94.2 | 95.8 |
| Broiler meat production (million tonnes): | |||||||||||
| WORLD | 50.1 | 63.1 | 64.3 | 68.3 | 72.8 | 73.6 | 78.2 | 81.2 | 83.2 | 84.1 | 85.3 |
| *Meat from the slaughter of birds originating in a particular country, plus the meat equivalent of any such birds exported live. E=2013 and F=2014: 5m estimates and forecasts for chicken meat. F=2014 USDA forecast for broiler meat. Regional figures may not add up to the world totals due to rounding. Sources: FAO for chicken meat; USDA for broiler meat. |
|||||||||||
Drawing comparisons between the series data on poultry production are difficult because the figures can relate to poultry meat, chickens (table birds plus culled layers) or broilers. However, while the absolute levels differ somewhat, they tend to exhibit similar trends.
During the period 2000 to 2012, the production of poultry meat, according to the FAO, rose by more than 37 million tonnes at 3.7 per cent per year. For 2012, global chicken meat output was put at a little under 93 million tonnes, with turkey meat at 5.6 million tonnes, ducks at almost 4.5 million tonnes and goose meat 2.8 million tonnes, making a poultry meat total of 105.5 million tonnes. FAO’s Food Outlook report forecasts that poultry meat output could reach 108.7 million tonnes in 2014.
An Organisation for Economic Co-operation and Development (OECD) report suggests that global poultry meat production will expand by around 2.3 per cent per year between 2013 and 2023 to reach 134.5 million tonnes in the latter year, with poultry becoming the largest meat sector from 2020 on.
United States Department of Agriculture (USDA) economists monitor broiler meat output, which at 83.2 million tonnes in 2012, represented almost 90 per cent of chicken meat output or some 79 per cent of all poultry meat. For 2013 and 2014, global broiler output is assessed at 84.1 and 85.3 million tonnes, respectively.
Indigenous poultry meat production – defined as the eviscerated weight from the slaughter of birds originating in a particular country plus the meat equivalent of any such birds exported live – in Europe grew from 11.8 million tonnes in 2000 to 17.9 million tonnes in 2012. While chicken meat output rose from 9.3 to 15.5 million tonnes, turkey production slipped a shade from 2.0 million to 1.9 million tonnes. Duck production grew from 404,000 to 509,000 tonnes but goose meat declined from 79,000 tonnes to 60,000 tonnes. For the European Union (EU), the corresponding changes were: chicken from 8.2 to 10.6 million tonnes, turkey 2.0 to 1.9 million tonnes, ducks, 401,000 to 507,000 tonnes and goose meat 71,000 to 60,000 tonnes.
While chicken production in Europe expanded by some 6.1 million tonnes in the review period, just 2.5 million tonnes (41 per cent) of the extra came from EU member countries recording an annual growth rate of a little over two per cent. In contrast, output in non-EU European countries rocketed by almost 13 per cent per year from less than 1.2 million tonnes to nearly 4.9 million tonnes.
The individual country data for chicken production is presented in Table 2.
| Table 2. Indigenous chicken meat production in Europe ('000 tonnes eviscerated weight) | |||||||
| Country | 2000 | 2005 | 2008 | 2009 | 2010 | 2011 | 2012 |
|---|---|---|---|---|---|---|---|
| Albania | 2.6 | 6.9 | 11.9 | 10.5 | 11.2 | 11.9 | 11.1 |
| Austria | 83.5 | 82.7 | 82.0 | 98.2 | 104.4 | 111.8 | 108.0 |
| Belarus | 76.1 | 89.5 | 170.1 | 203.1 | 243.2 | 279.8 | 300.8 |
| Belgium | 315.3 | 313.0 | 334.6 | 345.3 | 362.2 | 362.2 | 362.2 |
| Bosnia/Herzegovina | 3.6 | 8.4 | 35.1 | 31.1 | 36.5 | 44.0 | 51.2 |
| Bulgaria | 104.4 | 75.8 | 104.4 | 128.9 | 111.0 | 107.0 | 111.9 |
| Croatia | 23.9 | 30.3 | 30.7 | 30.3 | 23.2 | 29.5 | 28.7 |
| Czech Rep. | 230.0 | 230.0 | 280.8 | 291.1 | 286.9 | 275.4 | 259.8 |
| Denmark | 187.0 | 182.0 | 176.0 | 168.0 | 186.0 | 186.2 | 177.0 |
| Estonia | 7.6 | 12.8 | 12.4 | 14.2 | 14.2 | 14.8 | 13.8 |
| Finland | 65.4 | 87.6 | 103.8 | 97.4 | 89.6 | 95.3 | 101.0 |
| France | 1,273.0 | 1,165.0 | 1,140.0 | 1,113.8 | 1,160.0 | 1,160.0 | 1,178.6 |
| Germany | 586.9 | 710.0 | 794.8 | 865.3 | 929.0 | 1,004.0 | 1,015.7 |
| Greece | 107.9 | 162.1 | 104.0 | 103.0 | 103.6 | 99.4 | 92.7 |
| Hungary | 281.8 | 270.2 | 277.8 | 268.5 | 268.7 | 272.0 | 290.5 |
| Iceland | 3.1 | 5.8 | 7.4 | 7.2 | 6.9 | 7.2 | 7.8 |
| Ireland | 84.0 | 91.0 | 75.7 | 88.8 | 103.4 | 109.7 | 110.7 |
| Italy | 761.8 | 695.0 | 790.3 | 822.3 | 865.0 | 889.0 | 938.6 |
| Latvia | 4.9 | 15.2 | 22.9 | 20.7 | 22.1 | 22.9 | 24.6 |
| Lithuania | 25.1 | 55.8 | 70.2 | 69.5 | 75.5 | 74.6 | 79.2 |
| Macedonia Rep. | 3.9 | 3.0 | 2.2 | 2.4 | 3.6 | 3.0 | 3.3 |
| Malta | 6.0 | 4.4 | 5.0 | 4.6 | 4.3 | 4.1 | 4.2 |
| Moldova | 14.3 | 24.4 | 21.6 | 21.5 | 33.7 | 36.7 | 34.1 |
| Netherlands | 631.0 | 712.2 | 716.3 | 927.0 | 877.8 | 906.3 | 953.8 |
| Norway | 43.0 | 49.8 | 74.7 | 71.2 | 75.9 | 75.1 | 81.0 |
| Poland | 531.1 | 799.8 | 740.8 | 1,086.4 | 1,115.1 | 1,165.0 | 1,414.3 |
| Portugal | 221.3 | 213.9 | 269.8 | 288.6 | 309.5 | 284.0 | 284.0 |
| Romania | 251.1 | 274.9 | 270.5 | 302.3 | 278.9 | 254.8 | 275.9 |
| Russian Federation | 752.2 | 1,326.7 | 1,990.6 | 2,304.7 | 2,548.9 | 2,875.3 | 3,279.0 |
| Serbia | - | - | 75.1 | 79.3 | 85.4 | 95.9 | 87.4 |
| Slovakia | 16.0 | 78.4 | 93.1 | 83.8 | 78.9 | 65.5 | 67.6 |
| Slovenia | 17.7 | 45.3 | 46.4 | 47.1 | 45.9 | 47.1 | 49.2 |
| Spain | 983.5 | 1,060.6 | 1,034.4 | 1,120.2 | 1,029.0 | 1,158.7 | 1,092.8 |
| Sweden | 91.3 | 99.9 | 110.4 | 109.1 | 115.0 | 113.9 | 112.1 |
| Switzerland | 39.0 | 52.7 | 61.3 | 62.9 | 66.8 | 71.1 | 74.4 |
| Ukraine | 190.0 | 463.0 | 685.1 | 766.0 | 859.8 | 880.1 | 961.0 |
| United Kingdom | 1,222.0 | 1,315.0 | 1,292.8 | 1,292.2 | 1,402.7 | 1,368.9 | 1,396.8 |
| EUROPEAN UNION | 8,144.9 | 8,815.5 | 9,007.7 | 9,813.5 | 9,988.8 | 10,208.3 | 10,567.2 |
| EUROPE | 9,308.2 | 10,878.8 | 12,116.7 | 13,348.5 | 13,935.9 | 14,564.0 | 15,435.7 |
| - no figure Source: FAO |
|||||||
Russian Federation clearly heads the production rankings (Table 3) with an output in 2012 of almost 3.3 million tonnes. Five other countries – Poland, the UK, France, Spain and Germany – produced more than one million tonnes, while a further three – the Ukraine, the Netherlands and Italy – had outputs of between 900,000 and a million tonnes. The combined production of these nine countries amounted to 12.2 million tonnes or almost 80 per cent of the regional total.
| Table 3. Chicken meat production ranking in Europe in 2012 ('000 tonnes) |
|
| Country | Production |
|---|---|
| Russian Federation | 3,279.0 |
| Poland | 1,414.3 |
| United Kingdom | 1,396.8 |
| France | 1,178.6 |
| Spain | 1,092.8 |
| Germany | 1,015.7 |
| Ukraine | 961.0 |
| Netherlands | 953.8 |
| Italy | 938.6 |
| Belgium | 362.2 |
| Belarus | 300.8 |
| Hungary | 290.5 |
| Portugal | 284.0 |
| Romania | 275.9 |
| Czech Rep. | 259.8 |
| Denmark | 177.0 |
| Sweden | 112.1 |
| Bulgaria | 111.9 |
| Ireland | 110.7 |
| Austria | 108.0 |
| Finland | 101.0 |
| Greece | 92.7 |
| Serbia | 87.4 |
| Norway | 81.0 |
| Lithuania | 79.2 |
| Switzerland | 74.4 |
| Slovakia | 67.6 |
| Bosnia/Herzegovina | 51.2 |
| Slovenia | 49.2 |
| Moldova | 34.1 |
| Croatia | 28.7 |
| Latvia | 24.6 |
| Estonia | 13.8 |
| Albania | 11.1 |
| Iceland | 7.8 |
| Malta | 4.2 |
| Macedonia Rep. | 3.3 |
| Source: FAO | |
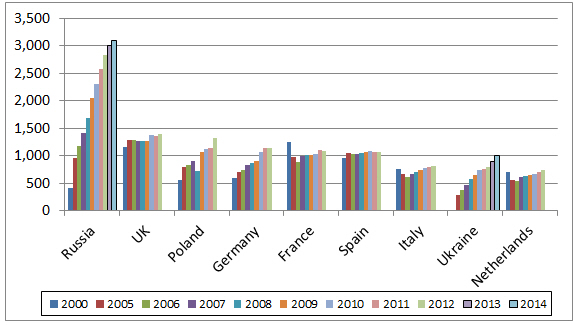
Table 4 and Figure 1 show how AVEC (Association of Poultry Processors and Poultry Trade in the EU) and the USDA view broiler production in key countries in Europe. Growth has been most dramatic in the Russian Federation and the Ukraine.
| Table 4. Leading broiler producers in Europe ('000 tonnes) | |||||||||||
| Country | 2000 | 2005 | 2006 | 2007 | 2008 | 2009 | 2010 | 2011 | 2012 | 2013 | 2014 |
|---|---|---|---|---|---|---|---|---|---|---|---|
| Russian Federation | 410 | 950 | 1,180 | 1,410 | 1,680 | 2,060 | 2,310 | 2,575 | 2,830 | 3,010 | 3,100 |
| United Kingdom | 1,163 | 1,283 | 1,290 | 1,261 | 1,267 | 1,269 | 1,380 | 1,354 | 1,400 | - | - |
| Poland | 560 | 800 | 824 | 896 | 730 | 1,060 | 1,123 | 1,150 | 1,325 | - | - |
| Germany | 587 | 710 | 749 | 826 | 868 | 911 | 1,073 | 1,150 | 1,150 | - | - |
| France | 1,242 | 986 | 886 | 993 | 1,009 | 1,008 | 1,041 | 1,096 | 1,080 | - | - |
| Spain | 965 | 1,045 | 1,030 | 1,034 | 1,059 | 1,063 | 1,085 | 1,073 | 1,063 | - | - |
| Italy | 762 | 666 | 612 | 670 | 713 | 742 | 780 | 796 | 808 | - | - |
| Ukraine | 20 | 289 | 372 | 475 | 570 | 650 | 733 | 767 | 800 | 900 | 1,000 |
| Netherlands | 697 | 552 | 547 | 612 | 626 | 655 | 664 | 710 | 738 | - | - |
| EU-27 | 7,970 | 8,169 | 7,740 | 8,492 | 8,526 | 8,949 | 9,478 | 9,639 | 9,914 | 9,800 | 9,950 |
| - no figure Sources: AVEC, USDA |
|||||||||||
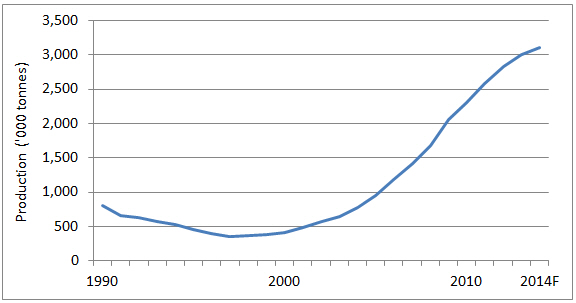
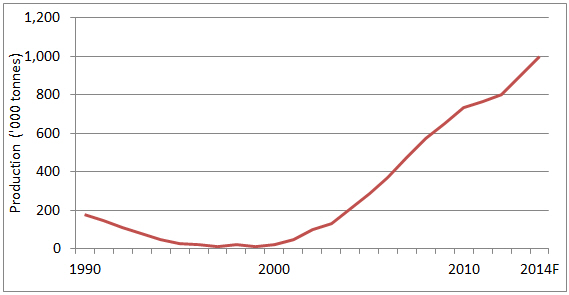
Figures 2 and 3 reveal the production trends since 1990 in these two countries. In both Russia and Ukraine, output actually contracted during the first 10 years. Between 2000 and the estimates for 2014, however, it escalated sharply with Russia recording an average 15.5 per cent per year rise, while for Ukraine, the increase has been a massive 32 per cent per year.
That the Russia Federation has recently imposed a ban on agricultural and fishery imports from the US, the EU, Canada, Australia and Norway might give domestic production a small boost but it is possible that the deficit created by the bans could be offset by increased imports from other countries, particularly Brazil and Argentina.
The quantities purchased from other European countries are not particularly large hence the ban is not likely to impact severely on their production. Of note is that Russia’s poultry meat imports have halved since 2009 to around 500,000 tonnes.
Broiler output from the United Kingdom, at 1.4 million tonnes in 2012, shows a gain of 1.6 per cent per year.
Close behind comes Poland although its industry has expanded much faster at almost 7.5 per cent per year.
The chicken sector in Germany has also chalked up good growth of close to six per cent per year since 2000.
Although output in France has increased in recent years, the total in 2012 was still some 13 per cent short of the 2000 level.
The European Commission anticipates growth of little more than one per cent per year in EU poultry meat output between the 2012 figure of 12.7 million tonnes and its estimate for 2015 of a little over 13 million tonnes.
However, the FAO’s poultry meat figure for 2012 is already around 13.1 million tonnes. Based on the FAO data, which indicated that chicken meat output in the EU amounted to 10.6 million tonnes in 2012, it looks as though the 2015 figure will be about 11 million tonnes.
A report by Dr Peter L.M. van Horne of the Agricultural Economics Research Institute at Wageningen in the Netherlands on the competitiveness of the EU poultry meat sector has highlighted the higher production costs incurred by EU producers from having to comply with European legislation related to environment protection, animal welfare and food safety.
In addition the reports states: “At the same time, the EU is negotiating with other countries or groups of countries to liberalise trade in agricultural products.”
The net result of these two negative factors on EU production could well be increased imports into the EU from third countries in general and non-EU European countries such as Ukraine in particular.
Regarding Brazil, Dr van Horne notes that this country has no legislation for poultry on animal welfare at the farm level or during transport.
On the optimistic side, the report highlights ways in which the EU industry can develop new markets in the retail and catering sectors for speciality birds (free-range, organic) and added-value products which could give chicken production a boost.
Looking further ahead, the European Commission foresees an expansion in poultry meat production of less than 0.8 per cent per year to 2023 as EU output climbs to 13.6 million tonnes. For Europe as a whole, the 2023 figure could well be in the region of 23 million tonnes.
October 2014


