

GLOBAL POULTRY TRENDS 2014: Europe's Chicken Exports Double
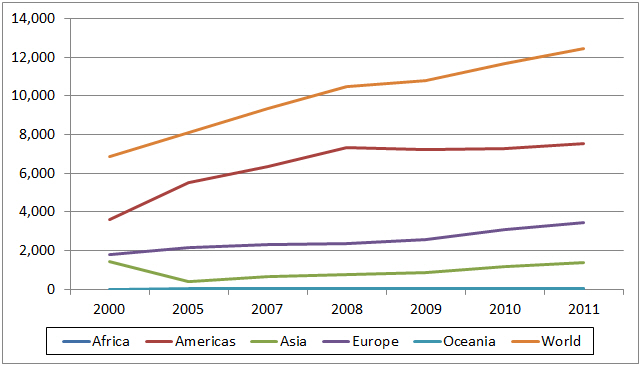
Exports of fresh/frozen chicken from European countries almost doubled between 2000 and 2011 to reach 3.5 million tonnes in the latter year, according to industry analyst, Terry Evans.Growing world demand has resulted in a rapid expansion in the trade in chicken meat. Data for every country is currently only available to 2011 when global exports of fresh/frozen chicken amounted to some 12.5 million tonnes (Table 1, Figure 1).
However, alongside this is a growing trade in prepared/processed chicken meat the annual total having increased from around 600,000 tonnes back in 2000 to almost two million tonnes in 2011 (Table 2). The latter figure is equivalent to around 2.9 million tonnes eviscerated weight making the world total trade for all forms of chicken meat of around 15.5 million tonnes.
| Table 1. World trade in fresh/frozen chicken meat ('000 tonnes) | |||||||
| 2000 | 2005 | 2007 | 2008 | 2009 | 2010 | 2011 | |
|---|---|---|---|---|---|---|---|
| EXPORTS | |||||||
| Africa | 9.5 | 4.8 | 6.5 | 9.5 | 46.2 | 61.5 | 56.2 |
| Americas | 3,627.4 | 5,516.0 | 6,366.4 | 7,311.6 | 7,234.9 | 7,252.7 | 7,530.4 |
| Asia | 1,432.2 | 420.6 | 639.1 | 765.8 | 876.2 | 1,187.7 | 1,373.1 |
| Europe | 1,805.1 | 2,137.3 | 2,302.6 | 2,344.7 | 2,592.1 | 3,115.7 | 3,477.8 |
| Oceania | 14.3 | 21.8 | 28.2 | 31.0 | 33.3 | 29.2 | 32.8 |
| World | 6,888.4 | 8,100.6 | 9,342.9 | 10,462.6 | 10,782.7 | 11,646.8 | 12,470.2 |
| IMPORTS | |||||||
| Africa | 259.0 | 512.9 | 673.6 | 717.8 | 861.2 | 1,065.5 | 1,254.4 |
| Americas | 556.0 | 910.5 | 1,132.3 | 1,373.7 | 1,380.3 | 1,416.6 | 1,509.8 |
| Asia | 3,276.7 | 2,767.2 | 3,654.0 | 4,274.9 | 4,670.9 | 5,021.5 | 5,780.0 |
| Europe | 1,811.2 | 3,223.6 | 3,171.0 | 3,374.2 | 3,095.0 | 2,879.7 | 2,790.3 |
| Oceania | 26.4 | 35.5 | 35.6 | 37.9 | 42.6 | 47.0 | 57.0 |
| World | 5,929.3 | 7,449.8 | 8,666.5 | 9,778.5 | 10,050.0 | 10,430.4 | 11,391.5 |
| Source: FAO | |||||||
| Table 2. World trade in prepared/processed chicken meat ('000 tonnes) | |||||||
| 2000 | 2005 | 2007 | 2008 | 2009 | 2010 | 2011 | |
|---|---|---|---|---|---|---|---|
| EXPORTS | |||||||
| Africa | 1.8 | 2.1 | 3.3 | 1.4 | 1.0 | 0.8 | 0.7 |
| Americas | 92.9 | 270.2 | 381.9 | 427.1 | 418.5 | 427.6 | 424.8 |
| Asia | 212.4 | 515.8 | 606.5 | 599.3 | 603.0 | 700.8 | 814.6 |
| Europe | 260.8 | 432.7 | 551.9 | 635.0 | 680.3 | 694.8 | 746.3 |
| Oceania | 2.2 | 1.8 | 0.6 | 1.0 | 1.8 | 2.9 | 3.4 |
| World | 570.1 | 1,222.6 | 1,544.2 | 1,663.8 | 1,704.5 | 1,827.0 | 1,989.7 |
| IMPORTS | |||||||
| Africa | 1.9 | 7.0 | 8.7 | 8.9 | 7.3 | 7.7 | 10.7 |
| Americas | 67.8 | 90.6 | 119.4 | 127.4 | 122.4 | 137.0 | 154.8 |
| Asia | 186.7 | 389.6 | 448.3 | 412.6 | 429.4 | 538.2 | 648.9 |
| Europe | 304.3 | 677.6 | 804.1 | 932.2 | 948.0 | 1,009.2 | 1,075.0 |
| Oceania | 1.3 | 2.0 | 3.2 | 4.1 | 5.4 | 8.9 | 10.0 |
| World | 561.8 | 1,166.8 | 1,383.6 | 1,485.2 | 1,512.4 | 1,701.0 | 1,899.4 |
| Source: FAO | |||||||
Chicken Meat Exports from the EU
Although exports of fresh/frozen chicken from European countries almost doubled between 2000 and 2011 to reach 3.5 million tonnes in the latter year, it only represents just over a quarter of the global business (Table 1). The bulk of Europe’s trade is conducted between EU member countries as, of the near 3.4 million tonnes exported by EU nations in 2011, only 30 per cent was sold to countries outside the Community (Table 3).
| Table 3. Exports of fresh/frozen and processed chicken meat from European countries (tonnes) |
|||||||
| Country | 2000 | 2005 | 2007 | 2008 | 2009 | 2010 | 2011 |
|---|---|---|---|---|---|---|---|
| FRESH/FROZEN CHICKEN | |||||||
| Albania | 2 | 0 | 0 | 5 | 0 | 0 | 0 |
| Austria | 4,268 | 18,318 | 25,358 | 25,976 | 29,400 | 30,867 | 26,376 |
| Belarus | 6,000 | 9,914 | 7,142 | 5,801 | 20,457 | 37,692 | 73,605 |
| Belgium | 268,551 | 313,233 | 310,800 | 316,996 | 344,015 | 385,188 | 407,928 |
| Bosnia/Herzegovina | 30 | 17 | 279 | 579 | 1,597 | 3,763 | 4,724 |
| Bulgaria | 4,988 | 7,832 | 10,631 | 9,379 | 23,499 | 37,861 | 39,470 |
| Croatia | 1,340 | 2,947 | 2,179 | 2,690 | 2,705 | 2,764 | 3,738 |
| Czech Rep. | 4,536 | 21,926 | 18,452 | 18,121 | 19,089 | 22,194 | 21,988 |
| Denmark | 107,403 | 102,357 | 86,385 | 77,152 | 83,715 | 84,915 | 72,507 |
| Estonia | 18,307 | 2,985 | 1,400 | 2,950 | 3,526 | 4,664 | 7,332 |
| Finland | 1,503 | 7,662 | 8,748 | 9,656 | 9,375 | 8,576 | 9,422 |
| France | 415,059 | 355,783 | 326,154 | 342,688 | 348,464 | 381,245 | 426,133 |
| Germany | 97,883 | 166,775 | 211,631 | 206,392 | 251,493 | 269,292 | 287,543 |
| Greece | 5,485 | 7,331 | 11,989 | 12,345 | 11,344 | 11,754 | 16,657 |
| Hungary | 38,380 | 32,561 | 21,176 | 35,391 | 35,735 | 57,841 | 81,178 |
| Iceland | 0 | 0 | 0 | 1 | 0 | 0 | 0 |
| Ireland | 17,855 | 14,225 | 18,758 | 16,910 | 22,291 | 38,824 | 53,406 |
| Italy | 28,874 | 62,593 | 50,708 | 53,514 | 55,704 | 86,232 | 86,759 |
| Latvia | 109 | 1,224 | 3,308 | 3,374 | 4,373 | 6,385 | 7,285 |
| Lithuania | 1,009 | 10,874 | 14,805 | 13,801 | 16,587 | 21,273 | 27,025 |
| Luxembourg | 470 | 154 | 226 | 309 | 275 | 255 | 299 |
| Macedonia Rep. | 93 | 134 | 127 | 57 | 49 | 10 | 79 |
| Malta | 1 | 1 | 5 | 8 | 0 | 0 | 41 |
| Moldova | 62 | 84 | 45 | 27 | 0 | 126 | 0 |
| Montenegro | - | - | 10 | 21 | 21 | 4 | 0 |
| Netherlands | 581,063 | 624,280 | 695,781 | 683,728 | 731,750 | 878,132 | 995,945 |
| Norway | 41 | 70 | 8 | 24 | 60 | 4 | 25 |
| Poland | 30,539 | 101,737 | 139,954 | 153,293 | 214,688 | 285,852 | 303,732 |
| Portugal | 1,108 | 2,018 | 5,775 | 3,638 | 5,158 | 7,279 | 10,329 |
| Romania | 802 | 2,573 | 1,655 | 8,906 | 29,767 | 54,652 | 73,182 |
| Russian Federation | 2,440 | 189 | 430 | 2,395 | 3,386 | 5,293 | 1,087 |
| Serbia | - | - | 2,131 | 1,566 | 1,689 | 2,130 | 2,505 |
| Slovakia | 1,383 | 11,944 | 16,096 | 15,564 | 14,666 | 26,768 | 22,972 |
| Slovenia | 1,322 | 7,265 | 12,039 | 13,592 | 12,191 | 15,170 | 15,101 |
| Spain | 48,345 | 53,753 | 51,971 | 72,072 | 65,163 | 95,609 | 113,769 |
| Sweden | 4,999 | 11,168 | 14,470 | 9,930 | 8,765 | 10,759 | 9,956 |
| Switzerland | 270 | 640 | 104 | 11 | 93 | 172 | 563 |
| Ukraine | 810 | 101 | 4,941 | 7,860 | 18,881 | 26,877 | 49,711 |
| United Kingdom | 109,337 | 181,462 | 226,959 | 217,976 | 202,140 | 215,292 | 225,420 |
| European Union | 1,795,202 | 2,125,049 | 2,288,024 | 2,327,313 | 2,546,836 | 3,040,948 | 3,346,512 |
| EU excl. internal | 703,248 | 654,152 | 577,018 | 665,934 | 705,423 | 892,736 | 1,012,819 |
| Europe | 1,805,133 | 2,137,341 | 2,302,630 | 2,344,698 | 2,592,111 | 3,115,714 | 3,477,792 |
| PROCESSED CHICKEN MEAT | |||||||
| European Union | 258,872 | 410,178 | 546,824 | 628,440 | 676,531 | 691,278 | 743,027 |
| EU excl. internal | 31,234 | 32,339 | 34,563 | 43,336 | 44,568 | 44,851 | 48,152 |
| Europe | 260,781 | 432,692 | 551,909 | 635,024 | 680,261 | 694,831 | 746,320 |
| - no figure Source: FAO |
|||||||
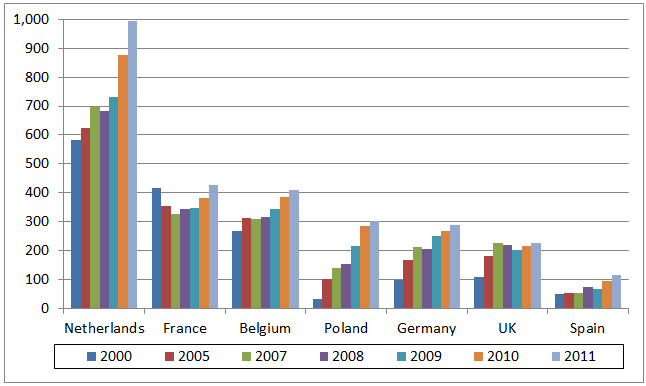
The Netherlands is easily the leading exporter (Table 4 and Figure 2), selling almost one million tonnes in 2011, more than a quarter of which went to Germany.
| Table 4. Leading chicken meat exporters in Europe ('000 tonnes) | |||||||
| Country | 2000 | 2005 | 2007 | 2008 | 2009 | 2010 | 2011 |
|---|---|---|---|---|---|---|---|
| Netherlands | 581.1 | 624.3 | 695.8 | 683.7 | 731.8 | 878.1 | 996.0 |
| France | 415.1 | 355.8 | 326.2 | 342.7 | 348.5 | 381.3 | 426.1 |
| Belgium | 268.6 | 313.2 | 310.8 | 317.0 | 344.0 | 385.2 | 407.9 |
| Poland | 30.5 | 101.7 | 140.0 | 153.3 | 214.7 | 285.9 | 303.7 |
| Germany | 97.9 | 166.8 | 211.6 | 206.4 | 251.5 | 269.3 | 287.5 |
| United Kingdom | 109.3 | 181.5 | 227.0 | 218.0 | 202.1 | 215.3 | 225.4 |
| Spain | 48.4 | 53.8 | 52.0 | 72.1 | 65.2 | 95.6 | 113.8 |
| Source: FAO | |||||||
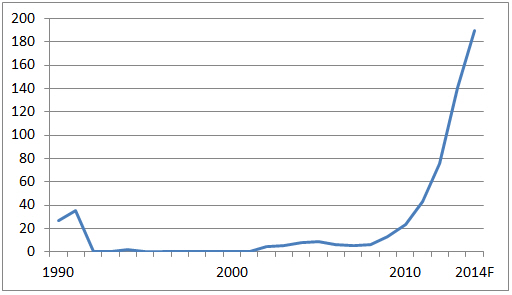
Because this FAO series has yet to be advanced beyond 2011, the emergence of Ukraine as a major player is not evident. However, data collected by the USDA reveals that from the low level of 23,000 tonnes in 2010, Ukraine’s broiler meat exports escalated to 141,000 tonnes in 2013, while the estimate for 2014 is a massive 190,000 tonnes (Figure 3).
In 2010 and 2011, EU chicken exports to third countries expanded dramatically to exceed one million tonnes (Table 3). However, the growth in this trade in 2012 and 2013 was much slower as a strong demand from African countries (mainly South Africa and Benin) and in the Middle East, (especially Saudi Arabia), was offset by lower shipments to Hong Kong and Russia. The European Commission considers that EU poultry meat exports to third countries could reach 1.4 million tonnes by 2023 as a result of increased purchases by Saudi Arabia and China.
According to a USDA FAS Gain report, EU broiler meat exports will decline a little in 2014 as a result of the impact of the suspension of EU poultry meat export restitutions on sales from France to the Middle East which will not be fully offset by increased exports of broiler parts from the Benelux, France and Poland to South Africa, Benin and Ghana.
The FAO data on imports of fresh/frozen chicken (Table 5) reveal that in 2011 the EU accounted for 2.2 million tonnes or 80 per cent of the total bought by European countries.
| Table 5. Imports of fresh/frozen and processed chicken meat into European countries (tonnes) |
|||||||
| Country | 2000 | 2005 | 2007 | 2008 | 2009 | 2010 | 2011 |
|---|---|---|---|---|---|---|---|
| FRESH/FROZEN CHICKEN MEAT | |||||||
| Albania | 10,119 | 16,986 | 13,883 | 18,412 | 17,893 | 18,668 | 22,201 |
| Austria | 12,908 | 29,184 | 30,696 | 30,557 | 33,025 | 37,873 | 35,018 |
| Belarus | 18,000 | 16,762 | 10,130 | 6,794 | 8,594 | 6,728 | 11,356 |
| Belgium | 60,227 | 84,042 | 89,698 | 97,667 | 95,921 | 105,214 | 132,240 |
| Bosnia/Herzegovina | 8,400 | 10,452 | 8,347 | 11,359 | 11,570 | 11,539 | 12,911 |
| Bulgaria | 22,000 | 15,857 | 22,209 | 33,615 | 47,001 | 60,333 | 83,880 |
| Croatia | 1,518 | 3,367 | 8,530 | 9,935 | 12,195 | 11,071 | 11,127 |
| Czech Rep. | 9,478 | 40,617 | 35,018 | 43,307 | 52,325 | 57,192 | 66,452 |
| Denmark | 7,936 | 22,991 | 24,161 | 24,410 | 26,506 | 32,908 | 35,105 |
| Estonia | 32,744 | 10,134 | 12,589 | 12,210 | 13,359 | 15,968 | 15,500 |
| Faroe Isl. | 320 | 294 | 358 | 221 | 429 | 454 | 449 |
| Finland | 1,329 | 3,351 | 3,406 | 3,794 | 3,915 | 3,878 | 3,069 |
| France | 124,247 | 180,628 | 213,282 | 230,153 | 256,076 | 292,493 | 317,514 |
| Germany | 195,432 | 221,030 | 241,690 | 216,017 | 261,762 | 299,075 | 320,551 |
| Greece | 27,920 | 34,666 | 35,853 | 40,941 | 40,213 | 39,686 | 41,564 |
| Hungary | 18,321 | 27,569 | 21,786 | 25,195 | 22,482 | 19,804 | 27,976 |
| Iceland | 12 | 29 | 158 | 337 | 224 | 250 | 467 |
| Ireland | 47,924 | 39,472 | 42,563 | 46,244 | 40,538 | 40,241 | 45,558 |
| Italy | 37,636 | 14,540 | 22,140 | 22,393 | 26,621 | 30,384 | 39,586 |
| Latvia | 17,177 | 25,698 | 25,863 | 24,147 | 21,717 | 23,255 | 23,290 |
| Lithuania | 9,524 | 27,018 | 28,040 | 26,109 | 19,258 | 15,500 | 18,619 |
| Luxembourg | 4,740 | 4,986 | 5,074 | 5,667 | 5,349 | 5,757 | 8,012 |
| Macedonia Rep. | 18,734 | 21,487 | 30,837 | 25,410 | 28,783 | 30,340 | 30,364 |
| Malta | 64 | 3,766 | 4,209 | 3,890 | 4,657 | 4,582 | 4,876 |
| Moldova | 4,636 | 45,420 | 12,207 | 20,543 | 7,250 | 13,883 | 12,356 |
| Montenegro | - | - | 1,871 | 3,564 | 3,581 | 4,758 | 4,350 |
| Netherlands | 111,268 | 271,190 | 232,315 | 408,035 | 309,557 | 308,155 | 355,311 |
| Norway | 89 | 252 | 139 | 212 | 579 | 52 | 45 |
| Poland | 12,793 | 43,414 | 33,493 | 16,419 | 17,572 | 17,337 | 14,886 |
| Portugal | 5,560 | 12,843 | 16,654 | 15,199 | 21,137 | 24,264 | 25,184 |
| Romania | 22,399 | 138,760 | 100,135 | 86,430 | 98,828 | 69,055 | 63,817 |
| Russian Federation | 580,099 | 1,203,984 | 1,203,650 | 1,139,102 | 911,954 | 602,850 | 384,169 |
| Serbia | - | - | 130 | 25 | 167 | 949 | 3,131 |
| Slovakia | 4,169 | 18,986 | 21,205 | 25,850 | 26,022 | 34,088 | 31,518 |
| Slovenia | 4,022 | 4,300 | 5,219 | 5,716 | 5,431 | 6,957 | 8,062 |
| Spain | 53,766 | 81,177 | 79,584 | 79,845 | 86,323 | 97,176 | 88,447 |
| Sweden | 13,088 | 29,620 | 31,992 | 34,309 | 34,604 | 36,850 | 33,506 |
| Switzerland | 23,044 | 27,490 | 32,498 | 35,072 | 37,024 | 34,916 | 35,453 |
| Ukraine | 25,987 | 133,688 | 130,502 | 248,600 | 180,263 | 122,834 | 50,770 |
| United Kingdom | 259,132 | 352,550 | 338,838 | 296,503 | 304,254 | 342,373 | 371,557 |
| European Union | 1,117,357 | 1,743,552 | 1,729,645 | 1,869,140 | 1,891,390 | 2,037,222 | 2,228,183 |
| EU excl. internal | 172,161 | 366,926 | 154,630 | 154,867 | 158,849 | 127,956 | 126,806 |
| Europe | 1,811,227 | 3,223,614 | 3,170,952 | 3,374,208 | 3,094,959 | 2,879,700 | 2,790,247 |
| PROCESSED CHICKEN MEAT | |||||||
| European Union | 290,668 | 629,623 | 765,567 | 897,418 | 918,426 | 978,801 | 1,044,110 |
| EU excl. internal | 87,442 | 304,125 | 350,687 | 421,426 | 432,568 | 431,594 | 444,355 |
| Europe | 304,268 | 677,625 | 804,076 | 932,225 | 947,963 | 1,009,188 | 1,074,992 |
| - no figure Source: FAO |
|||||||
Almost all the purchases by EU countries are from fellow member states. However, the quantities imported by non-EU European countries declined over the review period from around 700,000 tonnes a year to some 560,000 tonnes, having peaked at 1.5 million tonnes in 2008.
In 2011, five countries (Table 6 and Figure 4), the Russian Federation, the UK, Netherlands, Germany and France imported more than 300,000 tonnes. However, according to USDA data, the significant change in this business has been the halving of purchases by the Russian Federation (Figure 5) from a peak of more than 1.2 million tonnes from the late 1990s until 2008 to the current level of around 550,000 tonnes.
| Table 6. Leading importers of fresh/frozen chicken in Europe ('000 tonnes) | |||||||
| Country | 2000 | 2005 | 2007 | 2008 | 2009 | 2010 | 2011 |
|---|---|---|---|---|---|---|---|
| Russian Federation | 580.1 | 1,204.0 | 1,203.7 | 1,139.1 | 912.0 | 602.9 | 384.2 |
| United Kingdom | 259.1 | 352.6 | 338.8 | 296.5 | 304.3 | 342.4 | 371.6 |
| Netherlands | 111.3 | 271.2 | 232.3 | 408.0 | 309.6 | 308.2 | 355.3 |
| Germany | 195.4 | 221.0 | 241.7 | 216.0 | 261.8 | 299.1 | 320.6 |
| France | 124.3 | 180.6 | 213.3 | 230.2 | 256.1 | 292.5 | 317.5 |
| Belgium | 60.2 | 84.0 | 89.7 | 97.7 | 95.9 | 105.2 | 132.2 |
| Source: FAO | |||||||
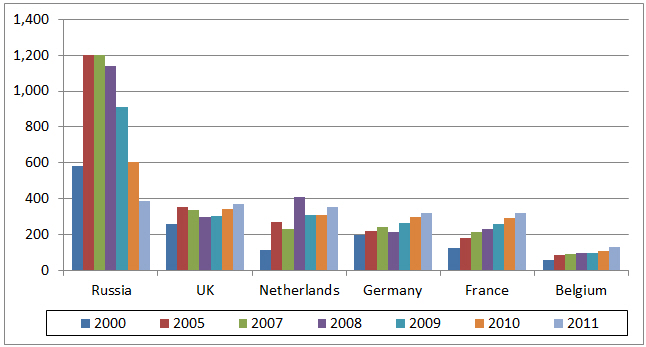
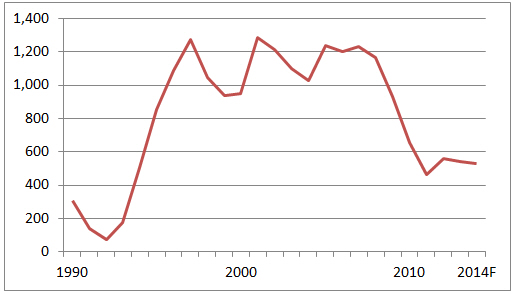
This decline is expected to continue with a USDA forecast of around 133,000 tonnes in 2023. The ban on imports into Russia from the US in particular might cut the 2014 estimate although there is the possibility that the reduction in purchases from this source could be made good by increased business with other countries especially Brazil and Argentina.
Brazil and Thailand remain the largest suppliers of chicken to the EU followed by Chile and China. After a small decline in 2013 due to reduced shipments from Brazil and Thailand, imports are expected to remain “flat” in 2014.
World trade in prepared/processed chicken meat has more than trebled since 2000 to the 2011 level of around two million tonnes (Table 2). In 2011 Europe shipping 750,000 tonnes was the second largest exporter behind Asia. The Netherlands and Germany were the major exporters each selling around 170,000 tonnes in 2011, followed by France and Belgium with some 55,000 tonnes, while the UK, Denmark, Ireland and Poland exported between 40,000 and 45,000 tonnes.
As with fresh/frozen chicken exports, the bulk of sales are to fellow EU member states. For both the Netherlands and Germany this accounted for more than 95 per cent of the business.
EU Chicken Meat Imports
Regarding imports, European countries purchase more than one million tonnes of prepared or processed chicken a year. As can be seen from above most of this trade is from EU countries.
The major third-country suppliers are Brazil and Thailand each of these supplying around 200,000 tonnes in 2011.
A total of some 170,000 tonnes (82 per cent), of Brazil’s shipments went to the Netherlands and Germany, though a further near 22,000 tonnes (11 per cent) was bought by the UK. The same three countries were Thailand’s biggest customers although, in this instance, the UK took the number one spot with 135,000 tonnes (66 per cent) followed by the Netherlands with 32,000 tonnes and Germany with almost 16,000 tonnes.
The opening of the EU market to Thai uncooked meat originally led to a significant increase in purchases of Thai salted and frozen cuts and parts to the detriment of Brazilian exports during the second half of 2012. This trend was expected to continue, though there is the possibility that exports of Thai cooked products to the EU could decline in the face of increased sales of uncooked products.
The latest data appear to indicate that the economic crisis in the EU has resulted in a decline in receipts of prepared, preserved and processed parts.
Further Reading
You can view the previous part in this series on European chicken production by clicking here.
October 2014


