


GLOBAL POULTRY TRENDS - Americas Egg Exports More Than Double
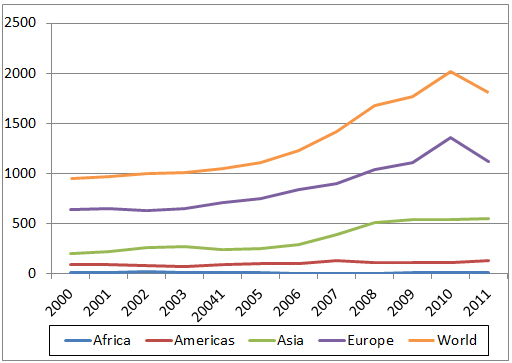
While shell egg exports by the Americas have more than doubled between 2000 ans 2011, they represent only a small proportion of the world total, according to industry analyst, Terry Evans. The region does account for just over one-third of global dried egg exports, however.Worldwide exports of eggs in shell more than doubled between 2000 and 2010 to exceed two million tonnes, but they then slipped back towards 1.8 million tonnes in 2011 (Table 1 and Figure 1).
The growth in trade has been primarily due to the movement of eggs from Europe and to a lesser extent Asia, as these two regions accounted for more than 92 per cent of global exports in 2011. The trends for regional imports of shell eggs (Table 1 and Figure 2) tell an almost identical story.
| Table 1. Global exports and imports of shell eggs ('000 tonnes) | |||||||
| 2000 | 2006 | 2007 | 2008 | 2009 | 2010 | 2011 | |
|---|---|---|---|---|---|---|---|
| Exports of hen eggs in shell: | |||||||
| Africa | 6.2 | 5.9 | 3.7 | 5.7 | 6.6 | 11.4 | 7.4 |
| Americas | 93.0 | 102.0 | 128.9 | 114.2 | 109.8 | 114.9 | 126.6 |
| Asia | 204.1 | 287.6 | 386.4 | 514.7 | 539.4 | 536.8 | 552.8 |
| Europe | 640.7 | 835.1 | 894.8 | 1,037.5 | 1,105.6 | 1,353.3 | 1,118.9 |
| Oceania | 0.9 | 1.1 | 1.0 | 1.9 | 3.8 | 4.8 | 3.7 |
| WORLD | 944.8 | 1,231.6 | 1,418.8 | 1,674.1 | 1,765.1 | 2,021.2 | 1,809.4 |
| Imports of hen eggs in shell: | |||||||
| Africa | 25.7 | 48.0 | 51.0 | 50.2 | 46.1 | 54.4 | 63.4 |
| Americas | 66.3 | 67.6 | 62.3 | 74.1 | 67.2 | 66.2 | 66.7 |
| Asia | 235.8 | 284.8 | 369.8 | 430.9 | 464.4 | 498.4 | 558.6 |
| Europe | 557.5 | 802.1 | 983.4 | 1,024.1 | 1,047.8 | 1,060.0 | 990.6 |
| Oceania | 0.7 | 2.4 | 1.5 | 1.7 | 2.4 | 2.8 | 1.8 |
| WORLD | 886.0 | 1,204.8 | 1,468.0 | 1,581.0 | 1,627.9 | 1,681.8 | 1,681.2 |
| Source: FAO | |||||||
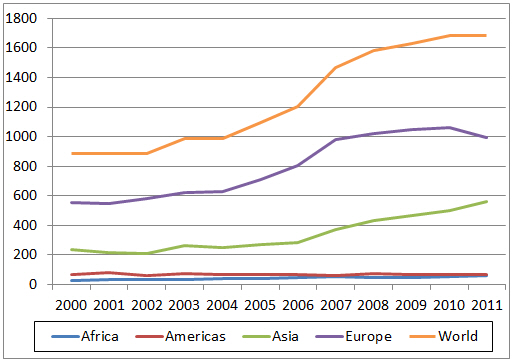
It is apparent from these trade tables that the global quantities exported and imported in a year frequently do not balance. The reasons for this were presented in the last report covering this region.
Unfortunately the FAO has yet to update the international trade figures presented in Tables 1 to 7, nevertheless, they have been included here for reference purposes.
Clearly, the Americas region is not a major exporter or importer of shell eggs, representing just seven per cent and around four per cent of the global total respectively (Tables 2 and 3).
| Table 2. Hen egg exports in shell from countries in the Americas (tonnes) | |||||||
| Country | 2000 | 2006 | 2007 | 2008 | 2009 | 2010 | 2011 |
|---|---|---|---|---|---|---|---|
| Argentina | 30 | 2,542 | 2,141 | 1,417 | 1,486 | 1,080 | 1,051 |
| Bahamas | 0 | 41 | 27 | 28 | 0 | 0 | 0 |
| Barbados | 0 | 10 | 11 | 18 | 19 | 23 | 19 |
| Bolivia | 236 | 49 | 12 | 0 | 0 | 0 | 0 |
| Brazil | 4,394 | 14,226 | 16,488 | 9,559 | 10,035 | 13,930 | 14,170 |
| Canada | 2,072 | 2,059 | 3,469 | 2,187 | 1,920 | 2,566 | 2,360 |
| Chile | 551 | 312 | 634 | 324 | 31 | 53 | 23 |
| Colombia | 3,370 | 58 | 3,882 | 15,117 | 1,283 | 72 | 6 |
| Costa Rica | 499 | 1,875 | 488 | 876 | 1,237 | 1,021 | 2,096 |
| Ecuador | 5,866 | 165 | 187 | 38 | 0 | 254 | 0 |
| El Salvador | 9,569 | 2,378 | 2,471 | 2,508 | 2,097 | 736 | 94 |
| Guatemala | 688 | 313 | 253 | 103 | 247 | 74 | 120 |
| Guyana | 0 | 0 | 90 | 0 | 0 | 0 | 2 |
| Honduras | 99 | 222 | 317 | 129 | 502 | 570 | 274 |
| Jamaica | 0 | 0 | 0 | 20 | 21 | 0 | 0 |
| Mexico | 58 | 27 | 15 | 107 | 910 | 2,771 | 7,216 |
| Nicaragua | 98 | 0 | 0 | 0 | 0 | 0 | 0 |
| Panama | 578 | 1,308 | 1,596 | 1,416 | 1,181 | 1,082 | 974 |
| Peru | 187 | 2,268 | 2,445 | 3,150 | 3,236 | 4,419 | 4,077 |
| Trinidad/Tobago | 10 | 16 | 11 | 8 | 16 | 16 | 16 |
| US | 64,582 | 73,940 | 94,328 | 77,094 | 85,458 | 86,103 | 93,962 |
| Uruguay | 138 | 108 | 0 | 134 | 133 | 133 | 140 |
| Venezuela Bol. Rep. | 0 | 44 | 34 | 0 | 0 | 1 | 0 |
| AMERICAS | 93,025 | 101,961 | 128,899 | 114,233 | 109,812 | 114,906 | 126,607 |
| WORLD | 944,793 | 1,231,590 | 1,414,784 | 1,674,065 | 1,765,121 | 2,021,225 | 1,809,404 |
| Source: FAO | |||||||
| Table 3. Hen egg imports in shell into countries in the Americas (tonnes) | |||||||
| Country | 2000 | 2006 | 2007 | 2008 | 2009 | 2010 | 2011 |
|---|---|---|---|---|---|---|---|
| Antigua/Barbuda | 0 | 73 | 134 | 197 | 197 | 13 | 25 |
| Argentina | 2,394 | 0 | 3 | 10 | 0 | 0 | 3 |
| Aruba | 80 | 123 | 140 | 0 | 1,062 | 1,023 | 1,029 |
| Bahamas | 24 | 377 | 377 | 557 | 869 | 1,334 | 1,126 |
| Barbados | 520 | 775 | 862 | 759 | 870 | 796 | 793 |
| Belize | 125 | 86 | 69 | 87 | 99 | 102 | 116 |
| Bermuda | 30 | 431 | 488 | 525 | 486 | 511 | 531 |
| Bolivia | 29 | 33 | 37 | 38 | 42 | 29 | 74 |
| Brazil | 25 | 247 | 282 | 369 | 169 | 122 | 165 |
| Canada | 23,286 | 21,894 | 20,058 | 24,933 | 27,696 | 24,904 | 23,199 |
| Cayman Isl. | 200 | 23 | 29 | 101 | 101 | 87 | 122 |
| Chile | 39 | 35 | 36 | 32 | 36 | 31 | 78 |
| Colombia | 1,298 | 145 | 333 | 133 | 37 | 108 | 159 |
| Costa Rica | 498 | 320 | 436 | 317 | 469 | 620 | 294 |
| Cuba | 5 | 0 | 143 | 0 | 0 | 0 | 0 |
| Dominican Rep. | 330 | 1,694 | 255 | 108 | 1,015 | 1,284 | 210 |
| Ecuador | 590 | 2,030 | 2,503 | 3,195 | 3,521 | 4,198 | 3,516 |
| El Salvador | 1,178 | 2,432 | 576 | 182 | 524 | 803 | 611 |
| Grenada | 0 | 6 | 0 | 0 | 32 | 5 | 3 |
| Guatemala | 294 | 1,595 | 900 | 197 | 1,359 | 1,597 | 1,281 |
| Guyana | 872 | 1,948 | 1,435 | 1,682 | 1,243 | 1,693 | 1,692 |
| Haiti | 9 | 189 | 280 | 455 | 588 | 467 | 524 |
| Honduras | 9,113 | 2,562 | 2,939 | 3,342 | 2,011 | 900 | 900 |
| Jamaica | 3,000 | 4,614 | 4,169 | 3,946 | 4,000 | 3,830 | 3,873 |
| Mexico | 9,495 | 13,685 | 8,804 | 5,513 | 7,594 | 7,330 | 11,463 |
| Netherlands Antilles | 70 | 104 | 431 | 500 | 351 | 294 | - |
| Nicaragua | 1,732 | 2,582 | 2,606 | 3,069 | 3,197 | 3,693 | 4,063 |
| Panama | 136 | 130 | 18 | 5 | 132 | 33 | 72 |
| Paraguay | 216 | 0 | 586 | 1,165 | 805 | 1,097 | 1,304 |
| Peru | 224 | 145 | 65 | 54 | 791 | 178 | 33 |
| Saint Kitts/Nevis | 22 | 28 | 18 | 11 | 43 | 1,870 | 1,870 |
| Saint Lucia | 18 | 12 | 7 | 8 | 36 | 45 | 45 |
| Saint Pierre/Miquelon | 0 | 3 | 5 | 3 | 8 | 6 | 2 |
| Saint Vincent/Grenadines | 0 | 20 | 48 | 11 | 11 | 24 | 4 |
| Suriname | 110 | 159 | 226 | 220 | 301 | 302 | 316 |
| Trinidad/Tobago | 2,765 | 3,156 | 3,285 | 2,989 | 3,203 | 2,801 | 2,882 |
| US | 3,576 | 3,719 | 3,354 | 3,396 | 2,830 | 3,441 | 4,047 |
| Uruguay | 59 | 52 | 51 | 39 | 28 | 28 | 191 |
| Venezuela Bol. Rep. | 3,935 | 2,172 | 6,332 | 15,909 | 1,322 | 553 | 74 |
| AMERICAS | 66,297 | 67,599 | 62,320 | 74,057 | 67,078 | 66,214 | 66,690 |
| WORLD | 886,023 | 1,204,805 | 1,468,005 | 1,580,962 | 1,627,866 | 1,681,751 | 1,681,176 |
| - no figure Source: FAO |
|||||||
Within the region, the United States is easily the leading exporter accounting for some three-quarters of the total. According to WASDE (World Agricultural Supply and Demand Estimates), the quantity of eggs (table, hatching and as a products) exported from the US in 2012 came close to 302 million dozen, rising to 372 million dozen in 2013.
The latest figure for 2014 shows an increase to 382 million dozen reflecting higher shipments to Canada and Mexico which have offset a decline in trade with Japan.
The estimate for 2015 currently stands at 375 million dozen. Major markets for US eggs include Mexico, Canada, Hong Kong and Trinidad and Tobago. Long-term forecasts do not indicate any great increase in this business.
Although Brazil is the second largest shell egg exporter in the region, the quantities involved are small representing less than one per cent of national production.
In recent years, sales have shown only little movement. Indeed, an estimate for 2013 of some 10,400 tonnes points to a cutback and is well below that of earlier years. While Venezuela is Brazil’s biggest customer, in the past year or so Brazilian exporters have been putting more effort into exporting eggs to the Middle East and in particular the United Arab Emirates, Saudi Arabia and Bahrain, these countries already being primary buyers of Brazilian chicken meat.
There are only two significant importers of shell eggs in the Americas – Canada and Mexico.
Imports into Canada are controlled via a tariff-rate quota which is the access level for imported eggs on the Canadian market under the World Trade Organisation’s international, trade obligations. The quantities imported between 2006 and 2011 ranged from around 20,000 tonnes a year to almost 28,000 tonnes. Latest figure for 2013 is in excess of 27,000 tonnes.
Traditionally, Mexico has imported only small quantities of shell eggs but, due to the impact of the avian influenza outbreaks on domestic supplies, the volumes have escalated sharply and in 2013 are considered to have exceeded 45,000 tonnes.
Dried Egg Trade
Sadly, the FAO data on trade in dried eggs does not include albumin. The total volume traded has changed little since 2007 (Tables 4 and 5 and Figures 3 and 4).
| Table 4. Exports of dried egg* from countries in the Americas (tonnes) | |||||||
| Country | 2000 | 2006 | 2007 | 2008 | 2009 | 2010 | 2011 |
|---|---|---|---|---|---|---|---|
| Argentina | 130 | 2,359 | 2,725 | 2,998 | 2,148 | 2,595 | 4,352 |
| Brazil | 434 | 364 | 403 | 153 | 152 | 24 | 9 |
| Canada | 2,837 | 3,373 | 2,188 | 1,893 | 1,458 | 1,021 | 874 |
| Chile | 96 | 28 | 25 | 73 | 40 | 0 | 0 |
| Colombia | 0 | 0 | 0 | 4 | 0 | 1 | 0 |
| El Salvador | 17 | 0 | 0 | 0 | 0 | 0 | 0 |
| Guatemala | 1 | 0 | 3 | 0 | 0 | 0 | 0 |
| Guyana | 0 | 0 | 0 | 0 | 0 | 11 | 0 |
| Mexico | 46 | 55 | 31 | 59 | 91 | 1 | 226 |
| Peru | 0 | 10 | 21 | 10 | 11 | 4 | 0 |
| US | 4,238 | 9,917 | 11,323 | 12,757 | 15,156 | 15,348 | 14,797 |
| Uruguay | 0 | 0 | 0 | 0 | 1 | 1 | 1 |
| AMERICAS | 7,799 | 16,106 | 16,719 | 17,947 | 19,057 | 19,006 | 20,259 |
| WORLD | 29,412 | 51,420 | 54,735 | 57,614 | 57,074 | 55,800 | 59,534 |
| * The data do not include dried albumin Source: FAO |
|||||||
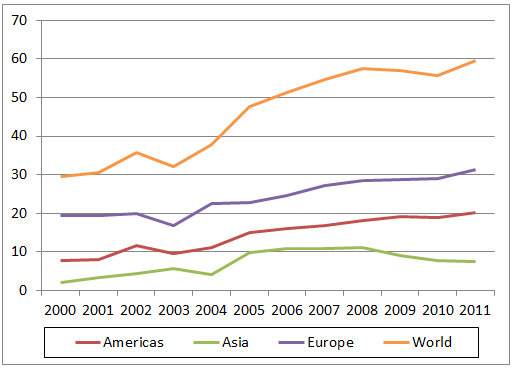
Of the global total exported in 2011, the Americas accounted for 34 per cent or 20,260 tonnes.
Within the region, the US with almost 15,000 tonnes and Argentina (4,400 tonnes) were the leaders in this field.
Most important customers for US products were Japan, (5,500 tonnes), Germany (2,400 tonnes), Canada, (1,500 tonnes), Mexico (1,300 tonnes) and Sweden (1,100 tonnes).
In 2013, exports of all forms of US dried egg amounted to some 18,200 tonnes. Denmark (866 tonnes), Austria (821 tonnes), and the Russian Federation (676 tonnes) were the leading buyers of Argentinian products in 2011. In 2013, Argentina’s dried egg exports amounted to almost 5,200 tonnes.
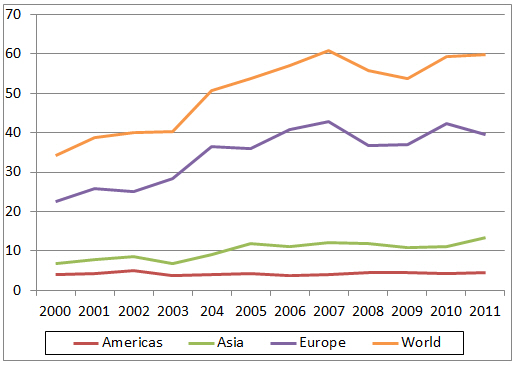
The quantities of dried egg imported into the Americas are small at around 4,500 tonnes a year (Table 5 and Figure 4), two-thirds of which are purchased roughly equally between Mexico and Canada.
| Table 5. Imports of dried egg* into countries in the Americas (tonnes) | |||||||
| Country | 2000 | 2006 | 2007 | 2008 | 2009 | 2010 | 2011 |
|---|---|---|---|---|---|---|---|
| Argentina | 366 | 3 | 0 | 56 | 97 | 290 | 358 |
| Bahamas | 0 | 93 | 163 | 134 | 1 | 46 | 54 |
| Barbados | 0 | 4 | 0 | 0 | 0 | 0 | 0 |
| Belize | 0 | 0 | 0 | 1 | 1 | 0 | 0 |
| Bolivia | 0 | 0 | 0 | 3 | 0 | 22 | 264 |
| Brazil | 65 | 14 | 5 | 0 | 0 | 0 | 0 |
| Canada | 1,280 | 651 | 891 | 1,138 | 1,508 | 1,819 | 1,493 |
| Chile | 20 | 32 | 64 | 20 | 44 | 40 | 71 |
| Colombia | 142 | 168 | 247 | 161 | 140 | 215 | 287 |
| Costa Rica | 2 | 53 | 41 | 59 | 63 | 47 | 41 |
| Cuba | 39 | 104 | 65 | 338 | 294 | 112 | 162 |
| Ecuador | 2 | 194 | 289 | 228 | 304 | 19 | 18 |
| El Salvador | 14 | 1 | 1 | 1 | 1 | 1 | 1 |
| Guatemala | 12 | 3 | 3 | 3 | 79 | 49 | 68 |
| Honduras | 0 | 0 | 0 | 2 | 0 | 3 | 4 |
| Jamaica | 0 | 9 | 4 | 25 | 26 | 11 | 4 |
| Mexico | 487 | 2,080 | 2,132 | 1,783 | 1,719 | 1,375 | 1,573 |
| Panama | 10 | 2 | 2 | 9 | 7 | 7 | 6 |
| Paraguay | 5 | 5 | 3 | 0 | 0 | 2 | 14 |
| Peru | 65 | 2 | 0 | 10 | 15 | 15 | 9 |
| Saint Lucia | 0 | 1 | 0 | 0 | 0 | 0 | 0 |
| Trinidad/Tobago | 114 | 203 | 105 | 147 | 160 | 160 | 112 |
| US | 475 | 56 | 2 | 280 | 8 | 16 | 1 |
| Uruguay | 71 | 21 | 15 | 16 | 29 | 66 | 82 |
| Venezuela Bol. Rep. | 856 | 14 | 5 | 22 | 11 | 15 | 0 |
| AMERICAS | 4,025 | 3,713 | 4,037 | 4,436 | 4,507 | 4,330 | 4,622 |
| WORLD | 34,244 | 56,954 | 60,850 | 55,672 | 53,671 | 59,408 | 59,732 |
| * The data do not include dried albumin Source: FAO |
|||||||
Liquid Egg Trade
The Americas accounts for only about eight per cent of global liquid egg exports (Table 6 and Figure 5) of which, the USA and Canada are responsible for about 79 per cent and 15 per cent respectively.
In 2011, Japan was the key buyer of US products taking some 11,200 tonnes although significant purchases were made by Canada, China, Singapore and Mexico. US exports of liquid egg have since expanded to almost 34,000 tonnes in 2013.
| Table 6. Exports of liquid egg from countries in the Americas (tonnes) | |||||||
| Country | 2000 | 2006 | 2007 | 2008 | 2009 | 2010 | 2011 |
|---|---|---|---|---|---|---|---|
| Argentina | 18 | 239 | 237 | 179 | 173 | 192 | 71 |
| Brazil | 874 | 2,688 | 2,019 | 2,393 | 2,278 | 1,961 | 1,278 |
| Canada | 1,783 | 2,647 | 1,943 | 2,542 | 2,094 | 4,332 | 3,644 |
| Colombia | 0 | 0 | 1 | 0 | 0 | 0 | 0 |
| Costa Rica | 0 | 0 | 2 | 0 | 0 | 0 | 0 |
| El Salvador | 870 | 561 | 598 | 194 | 9 | 0 | 0 |
| Jamaica | 0 | 0 | 1 | 0 | 0 | 0 | 0 |
| Mexico | 0 | 0 | 0 | 5 | 57 | 177 | 104 |
| Peru | 553 | 0 | 124 | 462 | 214 | 28 | 44 |
| USA | 16,548 | 15,889 | 15,335 | 14,973 | 14,343 | 14,961 | 18,651 |
| Uruguay | 0 | 12 | 5 | 3 | 13 | 13 | 13 |
| Venezuela Bol. Rep. | 1 | 22 | 6 | 0 | 0 | 0 | 0 |
| AMERICAS | 20,647 | 22,058 | 20,271 | 20,751 | 19,181 | 21,664 | 23,805 |
| WORLD | 144,191 | 205,274 | 217,255 | 235,998 | 266,462 | 272,639 | 313,984 |
| Source: FAO | |||||||
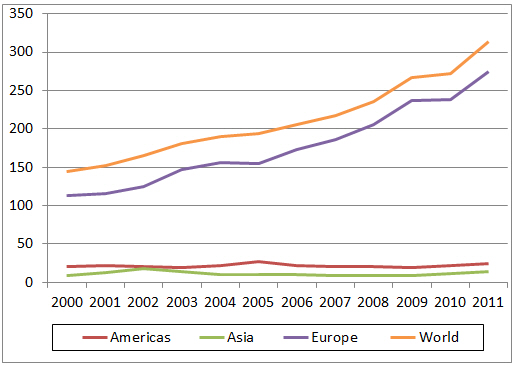
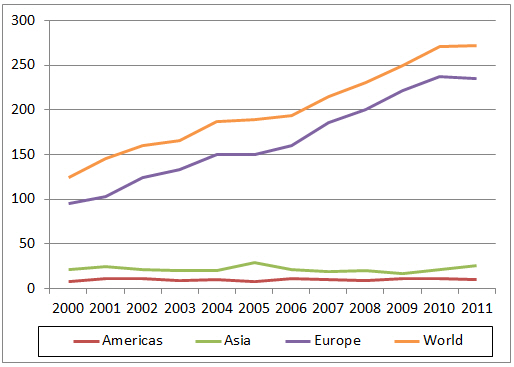
Liquid egg imports into the Americas have shown little movement around 10,000 tonnes a year since 2006 (Table 7 and Figure 6) with the US, Canada and Mexico the biggest purchasers.
| Table 7. Imports of liquid egg into countries in the Americas (tonnes) | |||||||
| Country | 2000 | 2006 | 2007 | 2008 | 2009 | 2010 | 2011 |
|---|---|---|---|---|---|---|---|
| Antigua/Barbuda | 0 | 0 | 0 | 0 | 0 | 0 | 9 |
| Argentina | 546 | 12 | 4 | 0 | 12 | 0 | 0 |
| Aruba | 1 | 0 | 0 | 0 | 7 | 7 | 7 |
| Bahamas | 140 | 206 | 191 | 199 | 282 | 256 | 231 |
| Barbados | 15 | 25 | 37 | 46 | 64 | 87 | 108 |
| Bermuda | 100 | 50 | 44 | 29 | 4 | 1 | 1 |
| Bolivia | 8 | 0 | 0 | 4 | 1 | 0 | 1 |
| Canada | 1,857 | 2,066 | 2,430 | 1,905 | 3,985 | 2,284 | 2,191 |
| Chile | 0 | 25 | 9 | 6 | 98 | 186 | 21 |
| Colombia | 2 | 1 | 0 | 0 | 0 | 0 | 0 |
| Costa Rica | 382 | 851 | 378 | 584 | 380 | 426 | 567 |
| Cuba | 5 | 0 | 3 | 0 | 0 | 251 | 239 |
| Ecuador | 6 | 0 | 0 | 0 | 0 | 331 | 302 |
| El Salvador | 111 | 3 | 0 | 0 | 25 | 19 | 20 |
| Guatemala | 883 | 646 | 643 | 234 | 178 | 84 | 180 |
| Guyana | 0 | 0 | 3 | 0 | 0 | 0 | 0 |
| Haiti | 3 | 0 | 0 | 0 | 0 | 0 | 0 |
| Honduras | 98 | 37 | 17 | 35 | 12 | 1 | 1 |
| Jamaica | 3 | 1 | 2 | 1 | 27 | 0 | 2 |
| Mexico | 907 | 2,158 | 1,109 | 478 | 1,729 | 1,797 | 1,394 |
| Netherlands Antilles | 20 | 60 | 11 | 18 | 24 | 10 | - |
| Nicaragua | 0 | 3 | 2 | 1 | 1 | 1 | 1 |
| Panama | 100 | 19 | 24 | 26 | 20 | 21 | 30 |
| Paraguay | 3 | 1 | 0 | 0 | 0 | 0 | 0 |
| Peru | 290 | 145 | 127 | 93 | 0 | 0 | 0 |
| Saint Kitts/Nevis | 0 | 3 | 0 | 0 | 0 | 6 | 1 |
| Saint Lucia | 1 | 1 | 2 | 0 | 0 | 2 | 2 |
| Saint Vincent/Grenadines | 0 | 0 | 1 | 1 | 0 | 2 | 2 |
| Trindad/Tobago | 65 | 61 | 65 | 105 | 65 | 19 | 81 |
| US | 1,596 | 1,811 | 1,731 | 2,726 | 2,473 | 4,047 | 3,829 |
| Uruguay | 28 | 244 | 228 | 172 | 62 | 110 | 334 |
| Venezuela Bol. Rep. | 200 | 2,075 | 2,332 | 2,210 | 1,323 | 739 | 517 |
| AMERICAS | 7,370 | 10,504 | 9,393 | 8,873 | 10,779 | 10,687 | 10,079 |
| WORLD | 124,335 | 193,459 | 215,287 | 230,369 | 249,486 | 270,486 | 271,809 |
| - no figure Source: FAO |
|||||||
March 2015


