

GLOBAL POULTRY TRENDS - Goose Meat Trade 'Flat'
World goose production is concentrated in Asia and especially mainland China, whilst Hungary and Poland dominate Europe's exports, writes industry analyst Terry Evans.Goose output close to 3 million tonnes
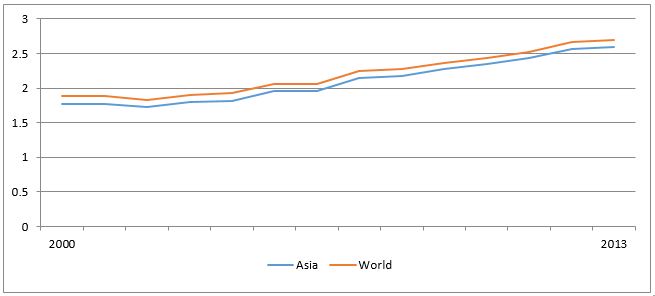
World goose meat production showed solid growth of nearly 3 per cent per year between 2000 and 2013 as the total climbed from 1.9 million tonnes to 2.7 million tonnes (Tables 5 and 6 and figure 4). At this rate output will currently be approaching 3 million tonnes.
| Table 5. Indigenous goose production | ||
| Year | World | Asia |
|---|---|---|
| 2000 | 1881.7 | 1767.5 |
| 2001 | 1874.5 | 1769.5 |
| 2002 | 1826.2 | 1718.0 |
| 2003 | 1895.0 | 1779.1 |
| 2004 | 1930.1 | 1812.6 |
| 2005 | 2062.9 | 1949.4 |
| 2006 | 2059.4 | 1955.7 |
| 2007 | 2244.0 | 2149.0 |
| 2008 | 2275.6 | 2181.5 |
| 2009 | 2362.6 | 2266.3 |
| 2010 | 2439.0 | 2353.8 |
| 2011 | 2520.2 | 2428.5 |
| 2012 | 2669.6 | 2560.7 |
| 2013 | 2698.3 | 2592.9 |
| Source: FAO | ||
| Table 6. Indigenous goose meat production (tonnes) | |||||||
| Region/Country | 2000 | 2005 | 2009 | 2010 | 2011 | 2012 | 2013 |
|---|---|---|---|---|---|---|---|
| AFRICA | 33236 | 33588 | 33879 | 34064 | 34110 | 46073 | 46043 |
| Of which: | |||||||
| Egypt | 19700 | 20500 | 20731 | 20938 | 20944 | 32907 | 32907 |
| Madagascar | 13050 | 12588 | 12618 | 12597 | 12633 | 12633 | 12603 |
| AMERICAS | 1797 | 1901 | 1957 | 1957 | 2057 | 2152 | 2227 |
| Of which: | |||||||
| Argentina | 510 | 540 | 540 | 540 | 540 | 540 | 540 |
| Paraguay | 200 | 240 | 270 | 270 | 270 | 280 | 280 |
| Canada | 900 | 900 | 900 | 900 | 1000 | 1085 | 1160 |
| ASIA | 1767511 | 1949352 | 2266309 | 2353789 | 2428478 | 2560714 | 2592861 |
| Of which: | |||||||
| China, mainland | 1726920 | 1912000 | 2233220 | 2318974 | 2392019 | 2524589 | 2557098 |
| China, Taiwan Prov | 25850 | 23508 | 16915 | 18505 | 20200 | 19961 | 19550 |
| Israel | 4500 | 3410 | 3500 | 3560 | 3600 | 3600 | 3600 |
| Myanmar | 1930 | 3040 | 5760 | 6261 | 6739 | 6800 | 6840 |
| Turkey | 4250 | 3238 | 2650 | 2350 | 1768 | 1618 | 1618 |
| EUROPE | 79050 | 77893 | 60312 | 49029 | 55405 | 60528 | 57071 |
| Of which: | |||||||
| Czech Rep | 4514 | 3119 | 1500 | 1500 | 750 | 603 | 607 |
| France | 6400 | 6000 | 5406 | 5164 | 5014 | 5000 | 5000 |
| Germany | 1615 | 1715 | 2333 | 2593 | 2683 | 2683 | 2683 |
| Hungary | 48000 | 36433 | 27157 | 16775 | 24038 | 29011 | 26441 |
| Poland | 6900 | 18400 | 18561 | 18492 | 18405 | 18405 | 18405 |
| UK | 2895 | 2935 | 2406 | 2000 | 2000 | 1996 | 1764 |
| EU | 71376 | 70693 | 60312 | 49029 | 55405 | 60527 | 57071 |
| OCEANIA | 100 | 120 | 120 | 120 | 120 | 120 | 120 |
| WORLD | 1881693 | 2062855 | 2362577 | 2438959 | 2520169 | 2669586 | 2698322 |
| Source: FAO | |||||||

In 2013 Asia, with an output of nearly 2.6 million tonnes, accounted for 96 per cent of the global total, up from 94 per cent back in 2000. Industry growth in this region averaged nearly 3 per cent year over the 13 years reviewed. Not surprisingly, mainland China with 2.56 million tonnes in 2013 accounted for 99 per cent of the regional total.
World goose production is almost entirely centred on Asia and in particular mainland China.In terms of the numbers of geese killed, the global total rose from 474 million in 2000 to 690 million in 2012, but eased back to 680 million in 2013 as the total in Asia slipped from 664 million ton 655 million. Since 2000, geese numbers in Europe contracted from 18.4 million to 12.6 million.
Although the numbers are small, production in Myanmar increased over the period, in contrast to the decline which occurred in Taiwan, Israel and Turkey.
Between 2000 and 2013 goose meat production in Europe contracted from 79,000 tonnes to 57,000 tonnes.
Although Hungary continued to be the biggest producer in the region, output actually declined by a massive 45 per cent since 2000, from 48,000 tonnes to less than 27,000 tonnes, at which point it represented 46 per cent of the Europe total compared with 61 per cent back in 2000.
Although output in Poland nearly trebled between 2000 and 2009, it has since appeared to have stabilised at around the 18,500 tonnes a year mark. However, that the FAO figures did not change between 2011 and 2013 may well indicate that, in order to assess a regional total, the 2011 figure was inserted into the following years’ data because official figures were unavailable.
Though the numbers are small rising from 33,000 tonnes to 46,000 tonnes the expansion which has occurred in Africa averaged 2.5 per cent per year over the period as output in Egypt climbed from less than 20,000 tonnes to around 33,000 tonnes.
The industry in Madagascar appears to have been stable with annual output at around 13,000 tonnes a year.
Goose production in the Americas, and to an even lesser extent Oceania, was negligible.
“Flat” goose meat trade
The FAO trade data on goose meat includes guinea fowl, though the quantities of the latter will be tiny. While there have been some annual fluctuations in exports, in general terms, the volumes traded ranged from 45,000 tonnes to 50,000 tonnes a year between 2000 and 2009, falling back to around 33,000 tonnes in the next two years before recovering to the 50,000 tonnes level in 2012.
Reason why the EU export total in 2012 was higher than that for Europe was because the EU figure included data from Cyprus which was excluded from the Europe total.
EU countries accounted for all of Europe’s exports with just two countries, Hungary and Poland, representing 94 per cent of this business. Up until 2012, Poland was the leading exporter but, in that year, she had to bow to Hungary as this country took the number one spot with sales of nearly 18,300 tonnes (Table 7).
| Table 7. Exports of fresh and frozen goose and guinea fowl meat (tonnes) | |||||||
| Region/Country | 2000 | 2005 | 2008 | 2009 | 2010 | 2011 | 2012 |
|---|---|---|---|---|---|---|---|
| AFRICA | 1 | 0 | 2 | 1 | 0 | 122 | 133 |
| ASIA | 24473 | 13092 | 17745 | 18785 | 2114 | 1969 | 13706 |
| Of which: | |||||||
| China, mainland | 24276 | 13067 | 15317 | 16167 | 0 | 0 | 11921 |
| Malaysia | 0 | 24 | 2427 | 2617 | 1885 | 1917 | 1194 |
| EUROPE | 23639 | 33315 | 27917 | 31879 | 30673 | 31151 | 36645 |
| Of which: | |||||||
| France | 392 | 241 | 358 | 172 | 200 | 295 | 381 |
| Germany | 383 | 233 | 1003 | 827 | 786 | 922 | 1155 |
| Hungary | 19827 | 12577 | 10495 | 11860 | 13038 | 13066 | 18272 |
| Poland | 0 | 14885 | 15714 | 18485 | 15903 | 16019 | 16145 |
| EU | 23639 | 33315 | 27916 | 31878 | 30695 | 31150 | 36652 |
| EU ex int | 5840 | 1210 | 1263 | 2276 | 3300 | 2439 | 5929 |
| WORLD | 48113 | 46407 | 45664 | 50665 | 32787 | 33242 | 50654 |
| Source: FAO | |||||||
Five countries, accounting for 82 per cent of the total, were the main recipients of Hungarian goose meat- Germany (7,700 tonnes), France (2,500 tonnes), Austria (2,000 tonnes), Hong Kong (1,800 tonnes) and the Russian Federation (1,000 tonnes).
Of Poland’s exports of nearly 16,200 tonnes, Germany purchased nearly three-quarters or almost 12,000 tonnes, Hong Kong took 1,600 tonnes and France 1,400 tonnes.
Virtually all of mainland China’s exports went to Hong Kong.
On the import side of the trade balance sheet, Hong Kong was the only country outside of Europe purchasing large quantities (Table 8).
| Table 8. Imports of fresh and frozen goose and guinea fowl meat (tonnes). | |||||||
| Region/Country | 2000 | 2005 | 2008 | 2009 | 2010 | 2011 | 2012 |
|---|---|---|---|---|---|---|---|
| AFRICA | 18 | 102 | 197 | 87 | 415 | 50 | 12 |
| Of which: | |||||||
| Benin | 0 | 94 | 155 | 77 | 158 | 0 | 0 |
| Niger | 0 | 0 | 0 | 0 | 0 | 26 | 8 |
| Gambia | 0 | 0 | 0 | 0 | 240 | 0 | 0 |
| AMERICAS | 643 | 1072 | 1049 | 1038 | 996 | 981 | 1039 |
| Of which: | |||||||
| Mexico | 643 | 1044 | 1042 | 1024 | 983 | 934 | 945 |
| Panama | 0 | 0 | 4 | 7 | 7 | 40 | 40 |
| ASIA | 13267 | 1251 | 499 | 570 | 51 | 120 | 15040 |
| Of which: | |||||||
| China, Hong Kong SAR | - | - | - | - | - | - | 13904 |
| China, Macao SAR | 0 | 144 | 0 | 0 | 0 | 0 | 455 |
| China, mainland | 13057 | 898 | 456 | 541 | 0 | 0 | 0 |
| Kazakhstan | - | 3 | 3 | 10 | 0 | 110 | 531 |
| EUROPE | 36242 | 25148 | 29563 | 27258 | 35040 | 32387 | 32473 |
| Of which: | |||||||
| Austria | 3834 | 836 | 1141 | 1639 | 2037 | 2452 | 2001 |
| Czech Rep | 2510 | 1082 | 622 | 1149 | 1546 | 1335 | 1265 |
| France | 3473 | 1882 | 1408 | 1351 | 1903 | 1142 | 3191 |
| Germany | 24347 | 16520 | 21429 | 18038 | 23658 | 22469 | 21714 |
| Russian Federation | 0 | 337 | 291 | 495 | 1263 | 260 | 1138 |
| Switzerland | 1276 | 1221 | 1381 | 1367 | 1335 | 1459 | 50 |
| EU | 35064 | 23389 | 27898 | 25405 | 32440 | 30668 | 31202 |
| EU ex Int | 234 | 7 | 0 | 0 | 0 | 0 | |
| OCEANIA | 43 | 0 | 1 | 1 | 1 | 0 | 16 |
| WORLD | 50213 | 27573 | 31309 | 28945 | 36503 | 33538 | 48580 |
| Source: FAO | |||||||
As indicated in the commentary on exports, the bulk of Germany’s purchases came from Poland and Hungary.
Once again, within Europe, EU member states were responsible for virtually all purchases, the annual quantities averaging a little over 31,000 tonnes. Here, Germany was easily the leading player taking around 22,000 tonnes, followed a long way behind by France (3,200 tonnes), the Czech Republic (1,300 tonnes) and the Russian Federation (1,100 tonnes).
In 2012, Hong Kong’s purchases were primarily from mainland China as out of a total of almost 14,000 tonnes, she bought 11,300 tonnes from this source, with just 1,200 tonnes coming from Poland.
September 2015


