

Global Poultry Trends: Poultry to Boost Global Meat Market Share Above 36 Per Cent
World meat production in 2016 forecast at 320.7 million tonnes carcase weight equivalent, will show little change from last year, according to the latest Food Outlook Report from the Food and Agriculture Organisation (FAO). Industry analyst Terry Evans reports.However, while the anticipated growth for all meats is a meagre 0.3 per cent, poultry meat output is expected to rise by more than 1 per cent to a record high of 116.2 million tonnes. In contrast, production of pig meat is expected to decline by 0.7 per cent to 116.4 million tonnes, just edging out poultry from the number one spot by a mere 200,000 tonnes (table 1).
| Table 1. World meat market (million tonnes). | ||||
| 2014 | 2015e | 2016f | % change (2016/2015) | |
| Production | 315.4 | 319.6 | 320.7 | 0.3 |
| Bovine meat | 68.0 | 67.9 | 68.4 | 0.8 |
| Poultry meat | 111.0 | 114.9 | 116.2 | 1.1 |
| Pig meat | 116.9 | 117.2 | 116.4 | -0.7 |
| Ovine meat | 13.9 | 14.0 | 14.1 | 0.7 |
| Trade | 30.6 | 29.8 | 30.6 | 2.8 |
| Bovine meat | 9.6 | 9.1 | 9.3 | 1.3 |
| Poultry meat | 12.8 | 12.3 | 12.7 | 3.5 |
| Pig meat | 7.0 | 7.2 | 7.5 | 4.4 |
| Ovine meat | 1.0 | 1.0 | 0.9 | -3.2 |
| e estimate, f forecast | ||||
| Source: FAO | ||||
Increases in poultry meat output are expected in the US, Brazil, the EU, India and Russia while lower production is forecast for China, Australia and South Africa.
Total poultry meat production will have escalated by some 5.2 million tonnes (4.7 per cent) since 2014 while that of the other main meats has hardly changed.
As a percentage of the total (excluding fish) poultry meat will account for some 36.2 per cent this year compared with 33.6 per cent back in 2010 when output just failed to reach 99 million tonnes.
Asia leads in poultry production
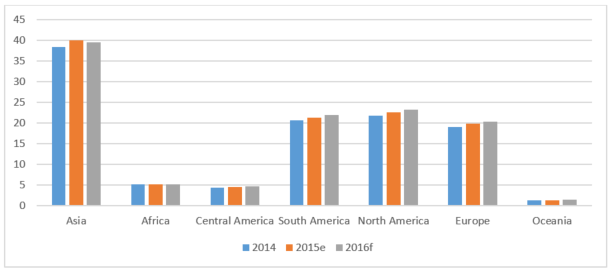
Asia is easily the leading producing region with North America and South America competing closely for second place (Table 2 and figure 1).
| Table 2. Poultry meat production, trade and utilisation ('000 tonnes). | ||||||||
| Region/country | Production | Imports | Exports | Utilisation | ||||
| 2015e | 2016f | 2015e | 2016f | 2015e | 2016f | 2015e | 2016f | |
| ASIA | 40017 | 39498 | 6813 | 7035 | 1973 | 1982 | 44870 | 44551 |
| China | 18961 | 18021 | 1579 | 1484 | 428 | 404 | 20112 | 19100 |
| Iran, Isl Rep | 2132 | 2160 | - | - | 60 | 65 | 2072 | 2095 |
| Japan | 1501 | 1507 | 1134 | 1190 | 9 | 9 | 2622 | 2688 |
| Korea, Rep | 850 | 865 | 134 | 135 | 31 | 35 | 960 | 965 |
| Kuwait | 47 | 50 | 143 | 157 | - | - | 189 | 206 |
| Malaysia | 1418 | 1436 | 57 | 63 | 40 | 42 | 1343 | 1457 |
| Saudi Arabia | 681 | 709 | 971 | 1117 | 60 | 70 | 1592 | 1756 |
| Singapore | 100 | 101 | 152 | 159 | 9 | 10 | 243 | 250 |
| Thailand | 1657 | 1687 | 4 | 4 | 874 | 918 | 796 | 773 |
| Turkey | 1913 | 1920 | 1 | 1 | 347 | 312 | 1568 | 1609 |
| Yemen | 149 | 148 | 57 | 48 | - | - | 205 | 196 |
| AFRICA | 5170 | 5163 | 1687 | 1757 | 89 | 94 | 6768 | 6826 |
| Angola | 32 | 31 | 232 | 251 | - | - | 264 | 282 |
| South Africa | 1571 | 1555 | 479 | 550 | 79 | 84 | 1971 | 2021 |
| CENTRAL AMERICA | 4573 | 4685 | 1618 | 1675 | 37 | 38 | 6154 | 6322 |
| Cuba | 36 | 36 | 229 | 563 | - | - | 265 | 298 |
| Mexico | 3132 | 3235 | 928 | 941 | 8 | 10 | 4052 | 4166 |
| SOUTH AMERICA | 21271 | 21891 | 266 | 280 | 4644 | 4957 | 16892 | 17214 |
| Argentina | 1843 | 1950 | 3 | 4 | 217 | 220 | 1629 | 1734 |
| Brazil | 13794 | 14236 | 4 | 4 | 4274 | 4578 | 9524 | 9662 |
| Chile | 700 | 725 | 115 | 131 | 141 | 149 | 674 | 707 |
| Venezuela | 1360 | 1400 | 15 | 5 | 1 | - | 1374 | 1405 |
| NORTH AMERICA | 22568 | 23179 | 385 | 387 | 3669 | 3727 | 19264 | 19839 |
| Canada | 1324 | 1383 | 235 | 250 | 176 | 182 | 1373 | 1451 |
| USA | 21244 | 21796 | 146 | 134 | 3493 | 3545 | 17887 | 18384 |
| EUROPE | 19943 | 20369 | 1233 | 1180 | 1788 | 1831 | 19390 | 19719 |
| European Union | 13757 | 13993 | 714 | 732 | 1386 | 1393 | 13084 | 13331 |
| Russian Federation | 4084 | 4256 | 258 | 193 | 78 | 96 | 4267 | 4354 |
| Ukraine | 1244 | 1263 | 63 | 64 | 164 | 173 | 1144 | 1154 |
| OCEANIA | 1356 | 1423 | 91 | 93 | 50 | 45 | 1396 | 1471 |
| Australia | 1150 | 1214 | 18 | 20 | 31 | 25 | 1137 | 1209 |
| New Zealand | 178 | 181 | 1 | 1 | 19 | 20 | 160 | 162 |
| WORLD | 114898 | 116208 | 12093 | 12408 | 12250 | 12675 | 114736 | 115941 |
| e estimated, f forecast | ||||||||
| Source: FAO | ||||||||

The quantities of all meat traded this year are expected to recover by some 2.8 per cent to 30.6 million tonnes though this is still at the 2014 level. For poultry meat the recovery is expected to be around 3.5 per cent as the total rises to some 12.7 million tonnes.
Thus poultry meat is forecast by the FAO to represent some 41.5 per cent of all trade, which compares with a similar tonnage or 41.8 per cent back in 2014.
The breakdown of the total for poultry meat production (table 2) reveals that an anticipated cutback of some 5 per cent in China, as a result of a fall in domestic consumption, coupled with this country having reduced access to replacement broiler breeding stock since trade was prohibited with countries that had outbreaks of highly pathogenic avian influenza (HPAI).
As a result, the estimated total for Asia has been lowered from 40.0 to 39.5 million tonnes. Hence, Asia’s contribution to the world total will have slipped from 34.8 to 34.0 per cent.
In contrast, substantial growth is foreseen in the US and Brazil, while increases are anticipated in the EU, India, Russia, Argentina, Mexico and Canada along with most other countries “As a result of a rising demand and sustained lower feed prices”.
Although production in China is likely to decline, this country will still account for almost 46 per cent of the Asian total.
Although well behind China in terms of total production, India continues to have the region’s fastest growing poultry meat industry. Production this year is projected to reach almost 2.9 million tonnes showing an increase of 7.7 per cent on the year and some 17 per cent more than the near 2.5 million tonnes recorded in 2014, and clearly a record of more than 3 million tonnes can be anticipated next year.
While all the other Asian countries listed anticipate increases in output this year, the volumes are not expected to be large.
Although in North America, production in the US has been hampered by outbreaks of HPAI, a 2.6 per cent increase is envisaged this year, pushing the total up towards 21.8 million tonnes. Growth of some 4.5 per cent is envisaged for Canada at almost 1.4 million tonnes.
Nearly two-thirds of the production in South America is accounted for by Brazil, as its industry is forecast to grow by some 3 per cent this year to reach a record 14.2 million tonnes. Argentina is looking to a near 6 per cent gain with annual output coming close to 2 million tonnes.
Production in Africa at almost 5.2 million tonnes is not expected to exceed last year’s levels, primarily because of the impact of increased imports on South Africa’s output.
Mexico accounts for nearly 70 per cent of the Central America total and this year is not expected to be an exception as output is forecast to climb by some 3 per cent to nearly 3.3 million tonnes out of the regional total of almost 4.7 million tonnes.
While an increase of 1.7 per cent is anticipated in the European Union with output close to 14 million tonnes, the big mover in Europe will be Russia. Here, more than 4 per cent growth is envisaged bringing the total close to 4.3 million tonnes. While a small rise is expected in the Ukraine, output will still fail to reach 1.3 million tonnes.
Production in Oceania effectively represents developments in Australia and to a much lesser extent New Zealand. Anticipated moderate expansion in both these countries will push the regional total above 1.4 million tonnes.
Record poultry trade
Poultry meat trade this year is expected to increase by 3.5 per cent to 12.7 million tonnes. Since peaking in mid-2014, prices have steadily declined such that in May 2016 they were 16 per cent below the year earlier level.
According to the FAO, “Prevailing low international prices and rising domestic consumption have been important factors stimulating import demand in a number of markets including Saudi Arabia, South Africa, Japan, Viet Nam, Cuba and the United Arab Emirates.”
The leading exporting region is South America, with the total coming close to 5 million tonnes this year, more than 90 per cent of which will be shipped from Brazil.
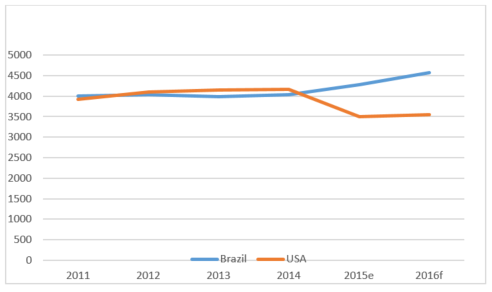
Brazil’s exports have escalated sharply and could reach almost 4.6 million tonnes compared with around 4 million tonnes in 2014, since when it has replaced the USA as the leading poultry meat exporter (figure 2).

It should be noted that the data presented in the Food Outlook reports is based on a marketing, season basis in contrast to a calendar year which is used in certain other reports.
Exports from North America almost entirely reflect trade from the US. Back in 2014, the US shipped some 4.2 million tonnes of poultry meat, but this figure fell by more than 16 per cent in 2015 as a result of HPAI outbreaks in the States causing some importers to look to alternative sources of supply.
The report states: “Containment and elimination of HPAI in the USA was projected to herald a substantial recovery in exports this year.”
However, “The reappearance of the disease in Indiana earlier this year has rekindled concern with the affected part of the State not being declared disease free until the beginning of May.”
As US exports over the first three months of this year were down by some 7.7 per cent, the FAO has forecast an annual rise of only 1.5 per cent for 2016 to around 3.6 million tonnes.
Total exports from Asia have shown little movement in recent years averaging just under 2 million tonnes a year. However, this report indicates that the recovery in shipments from Thailand, primarily to Japan, will continue and will likely exceed 900,000 tonnes compared with around 770,000 tonnes back in 2014.
European exports are fairly stagnant at around 1.8 million tonnes a year, with third-country sales from the EU amounting to some 1.4 million tonnes.
Exports from Africa are small, mainly reflecting trade from South Africa of around 80,000 tonnes a year.
There are several reasons why the total world trade figures for exports and imports, although close, do not equate exactly.
The biggest importing region is Asia, accounting for some 57 per cent of the world total. Imports into this area are expected to reach a record-exceeding 7 million tonnes.
Whereas purchases by China are not forecast to match the 2015 level because of a stagnant demand and HPAI-related import prohibitions, purchases by both Japan and Saudi Arabia look likely to come close to 1.2 million tonnes.
Receipts by African countries amount to around 1.8 million tonnes a year. But, while imports into Angola have declined when compared with 2014, South Africa has had to accept increasing quantities, mainly from Brazil and the EU, the total rising from less than 400,000 tonnes in 2014 to an estimated 550,000 tonnes in 2016.
Imports by European countries have tended to decline as a result of a growth in production in Russia and the country-specific trade embargoes imposed by this country which appear likely to continue until the end of 2017. For 2016, Russia’s poultry meat imports are assessed at less than 200,000 tonnes compared with 460,000 tonnes in 2014.


