

How Poultry Performed Globally in 2016 – and What to Expect in 2017
Growth was slow in the global production of meats in 2016 – but, according to a UN report, the poultry sector outstripped other meats by a factor of five. Poultry industry analyst Terry Evans reports on figures that suggest that well over a third of the 320 million tonnes of global meat production was poultry.Global production of all meats is expected to show an increase of only 0.2 per cent in 2016, but poultry meat output is forecast to rise by almost 1 per cent coming close to 116 million tonnes, according to the latest Global Information and Early Warning System (GIEWS) report, prepared by the Food and Agriculture Organisation of the United Nations (FAO).
The GIEWS report does not look further ahead, but based on USDA forecasts of a 1 per cent increase in world broiler production in 2017, it would appear that total poultry meat output next year will come close to a record 117 million tonnes.
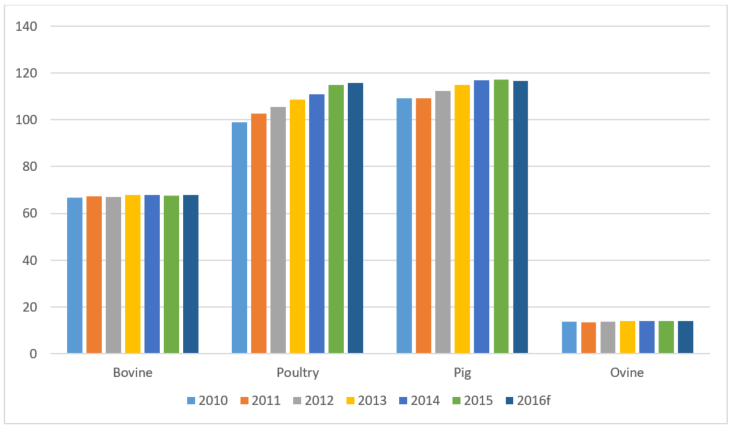
Taking a longer view, compared to 2010 the total meat supply has risen by almost 9 per cent while the gain for poultry meat has exceeded 17 per cent. While pig meat has held on to the number one spot, the gap between pig products and poultry has closed dramatically in the intervening years. While in 2010 global pig meat production outstripped poultry by more than 10 million tonnes, such that this year its lead could well reduce to less than a million tonnes (Table 1). Figure 1 highlights how production of bovine and ovine meat has virtually stagnated in recent years, as the increase in total meat has been driven by growth in both the poultry and pig sectors.
| Table 1. World meat market (million tonnes) | |||
|---|---|---|---|
| Production | 2010 | 2016f | % change |
| Bovine meat | 66.7 | 67.8 | 1.7 |
| Poultry meat | 98.9 | 115.8 | 17.1 |
| Pig meat | 109.3 | 116.5 | 6.6 |
| Ovine meat | 13.7 | 14.1 | 2.9 |
| TOTAL | 294.2 | 319.8 | 8.7 |
| Trade | |||
| Bovine meat | 7.7 | 9.1 | 18.2 |
| Poultry meat | 11.7 | 12.7 | 8.6 |
| Pig meat | 6.2 | 8.0 | 29.0 |
| Ovine meat | 0.8 | 0.9 | 12.5 |
| TOTAL | 26.7 | 31.1 | 16.5 |
| f = forecast | |||
| Source: FAO's Food Outlook | |||
Figure 1. The growth in world meat production has come from poultry and pigs (million tonnes).
As a result of the more rapid expansion in poultry production, this sector’s contribution to the world meat total has risen from 32.6 per cent back in 2010 to an anticipated 36.2 per cent in 2016.
This year a substantial expansion is forecast in the US and Brazil. Increased production is also forecast for the European Union, India, Mexico, Argentina and many other countries as their industries have responded to the stimulus afforded by a rising consumer demand and favourable feed costs.
In contrast, disappointing consumer demand in China is expected to result in a 5 per cent cutback in production to 18 million tonnes, while increased competition from imports could well bring about a small cutback in South Africa.
When compared to 2010, production has expanded in all the major regions (Table 2). On the basis of this analysis Asia, exhibiting a growth of more than 14 per cent since then, is the largest producing region with an output during 2016 in the region of 39.6 million tonnes.
| Table 2. Poultry meat production ('000 tonnes) | |||
|---|---|---|---|
| 2010 | 2016f | % change | |
| ASIA | 34626 | 39558 | 14.2 |
| China | 17601 | 18035 | 2.5 |
| India | 2650 | 2872 | 8.4 |
| Indonesia | 1435 | 1980 | 38.0 |
| Iran, Isl Rep | 1765 | 2160 | 22.4 |
| Japan | 1392 | 1507 | 8.3 |
| Korea, Rep | 653 | 913 | 39.8 |
| Kuwait | 44 | 50 | 13.6 |
| Malaysia | 1100 | 1425 | 29.6 |
| Saudi Arabia | 590 | 709 | 20.2 |
| Singapore | 95 | 101 | 6.3 |
| Thailand | 1208 | 1687 | 39.7 |
| Turkey | 1300 | 1910 | 46.9 |
| Yemen | 145 | 148 | 2.1 |
| AFRICA | 3998 | 5156 | 29.0 |
| Angola | 8 | 31 | 287.5 |
| South Africa | 1028 | 1548 | 50.6 |
| CENTRAL AMERICA | 4028 | 4637 | 15.1 |
| Cuba | 34 | 36 | 5.9 |
| Mexico | 2659 | 3187 | 19.9 |
| SOUTH AMERICA | 17047 | 21578 | 26.6 |
| Argentina | 1346 | 1861 | 38.3 |
| Brazil | 11787 | 14202 | 20.5 |
| Chile | 620 | 725 | 16.9 |
| Venezuela | 740 | 1140 | 54.1 |
| NORTH AMERICA | 20820 | 23184 | 11.4 |
| Canada | 1223 | 1388 | 13.5 |
| USA | 19597 | 21796 | 11.2 |
| EUROPE | 16499 | 20312 | 23.1 |
| European Union | 12272 | 14041 | 14.4 |
| Russian Federation | 2635 | 4150 | 57.5 |
| Ukraine | 1001 | 1264 | 26.3 |
| OCEANIA | 1049 | 1423 | 35.7 |
| Australia | 886 | 1214 | 37.0 |
| New Zealand | 140 | 181 | 29.3 |
| WORLD | 98067 | 115848 | 18.1 |
| f = forecast | |||
| Source: FAO's Food Outlook | |||
Although China is easily the most important producer, the increase since 2010 has been moderate at less than 3 per cent – contrasting with many other countries in the region that have recorded gains of over 30 per cent, though admittedly from a much smaller base. USDA data indicate that broiler production in China could fall by as much as 9 per cent in 2017.
According to the GIEWS report, production in India is now coming close to 3 million tonnes, though the annual total is still only a little over 8 per cent higher than six years ago. However, there can be wide differences in data depending on the source. For example, the USDA estimates that India will produce some 4.2 million tonnes of broiler meat in 2016 this year and forecasts 4.5 million tonnes for 2017. Turkey’s poultry meat industry has recorded an almost 47 per cent increase since 2010 with output now nearing 2 million tonnes.
Production in Iran is expected to approach 2.2 million tonnes this year showing a gain of more than 22 per cent since 2010.
Rapid growth in Indonesia will yield almost 2 million tonnes in 2016 against less than 1.5 million tonnes six years ago.
Primarily due to a 20 per cent expansion in Brazil since 2010, South America has become the second largest producing region with output climbing from 17.1 million to 21.6 million tonnes. This year saw a near 3 per cent increase in Brazil as production is expected to exceed 14.2 million tonnes. Based on USDA broiler forecasts it looks as though poultry meat output in Brazil will come close to 14.7 million tonnes in 2017. Of note is that production in Argentina is now around 1.9 million tonnes.
Although Venezuela’s industry has expanded by a dramatic 50 per cent since 2010, 2016’s estimated output of 1.1 million tonnes suggests a 7 per cent cut on last year’s 1.23 million tonnes.
The US dominates in North America with 2016 output estimated at 21.8 million tonnes, though the increase since 2010 amounts to only 11 per cent. However, continued growth is anticipated such that in 2017 US poultry meat output is likely to be around 22.2 million tonnes, pushing the regional total to almost 23.7 million tonnes.
Europe has witnessed an increase of more than 20 per cent since 2010, much of which has resulted from expansions in the Russian Federation and the Ukraine. However, according to the latest report, subdued domestic demand, reduced profitability and limited export opportunities have combined to restrain industry expansion in Russia. While the industry in the European Union is expected to grow by less than 2 per cent in 2016, output will still have reached a record in excess of 14 million tonnes.
Production in Central America is mainly linked to developments in Mexico which will likely see output hit a record 3.2 million tonnes this year.
Slow growth has been evident in Africa and although South Africa has managed to record a 50 per cent increase in production since 2010, latterly growth here has suffered a setback primarily due to increased competition from imports.
Poultry trade growth not as fast as production growth
Global trade in all meat is calculated to reach a record 31.1 million tonnes this year. Although poultry meat is dominant, this sector’s trade growth since 2010 has not matched that achieved by either beef or pig meat.
It is apparent from table 3 that the world total quantities of poultry meat exported and imported in a year do not balance. There are many reasons for this including:
- Some countries provide data on a general rather than specific product basis.
- Data may be presented on a financial or market year rather than a calendar year.
- There is a time lag between product leaving a country, which means for example consignments departing in December may not arrive at their destinations until January of the following year.
- There can be a misclassification of a product between the exporter and importer.
- There can be place-of-origin/final-destination inconsistencies. For example, country A may report that the final destination is country C, but the goods actually reach C via another country, B. As a result, country C may report that the place of origin of the goods was country B.
In addition, goods can be lost during transport, while occasionally discrepancies can occur due to a typing or calculation error. And, in some instances, exports may not be declared to circumvent an embargo or avoid tax payments.
| Table 3. Poultry meat trade ('000 tonnes) | ||||
|---|---|---|---|---|
| Imports | Exports | |||
| 2010 | 2016f | 2010 | 2016f | |
| ASIA | 6284 | 6979 | 2087 | 1986 |
| China | 1922 | 1441 | 1093 | 402 |
| India | 1 | - | 2 | 7 |
| Indonesia | 6 | 4 | - | - |
| Iran, Isl Rep | 50 | - | 28 | 78 |
| Japan | 965 | 1215 | 11 | 9 |
| Korea, Rep | 122 | 140 | 16 | 33 |
| Kuwait | 250 | 152 | 1 | - |
| Malaysia | 51 | 63 | 24 | 44 |
| Saudi Arabia | 684 | 986 | 3 | 70 |
| Singapore | 135 | 164 | 9 | 10 |
| Thailand | 2 | 4 | 659 | 923 |
| Turkey | 95 | 1 | 143 | 303 |
| Yemen | 104 | 48 | - | - |
| AFRICA | 1216 | 1746 | 40 | 93 |
| Angola | 250 | 198 | - | - |
| South Africa | 270 | 598 | 31 | 83 |
| CENTRAL AMERICA | 1319 | 1655 | 46 | 39 |
| Cuba | 200 | 218 | - | - |
| Mexico | 709 | 966 | 17 | 10 |
| SOUTH AMERICA | 456 | 292 | 4285 | 4893 |
| Argentina | 11 | 4 | 250 | 182 |
| Brazil | 1 | 4 | 3904 | 4552 |
| Chile | 75 | 140 | 107 | 149 |
| Venezuela | 255 | 5 | - | - |
| NORTH AMERICA | 311 | 385 | 3923 | 3775 |
| Canada | 206 | 223 | 186 | 179 |
| USA | 94 | 157 | 3737 | 3595 |
| EUROPE | 1868 | 1400 | 1211 | 1911 |
| European Union | 806 | 903 | 1120 | 1432 |
| Russian Federation | 675 | 232 | 19 | 108 |
| Ukraine | 156 | 70 | 12 | 207 |
| OCEANIA | 69 | 93 | 36 | 52 |
| Australia | 7 | 20 | 30 | 31 |
| New Zealand | 1 | 1 | 6 | 21 |
| WORLD | 11523 | 12550 | 11628 | 12749 |
| - = no figure; f = forecast | ||||
| Source: FAO's Food Outlook | ||||
Trading in poultry meat has expanded by around a million tonnes since 2010 to an estimated nearly 12.8 million tonnes in 2016 following an increase of some 4.4 per cent.
According to the GIEWS report, affordability and rising domestic consumption have been major factors stimulating imports in a number of markets, including South Africa, Japan, Iraq, the European Union, the Philippines, the United Arab Emirates, China, Mexico, Chile and Saudi Arabia. However, in Vietnam, growth in the domestic industry and falling domestic prices are likely to curb imports.
Similarly imports into the Russian Federation could be limited as the result of an increase in domestic production as well as the continuation of the country-specific trade embargo. Reduced imports are also anticipated for Angola, Benin, Canada and Cuba.
Compared with 2010, imports into Asia have increased but exports have shown little movement. While purchases by China have declined, imports into Japan and Saudi Arabia have risen sharply.
Greater purchases by South Africa have boosted the total for Africa.
Increased buying activity by Mexico has expanded the Central America total.
While poultry meat imports into North America have shown little change, Europe’s receipts have fallen reflecting, to a considerable extent, the drop in purchases by the Russian Federation.
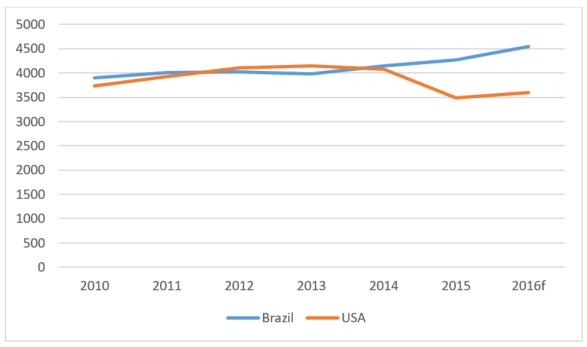
The report shows that nearly 70 per cent of global poultry meat exports come from South and North America. More precisely, just two countries, Brazil and the USA, account for 94 per cent of the combined shipments from these two regions. Figure 2 traces the movement of exports from these two countries since 2010. It is clear that up until 2014 they were racing neck and neck with sales of around 4 million tonnes a year. Since then Brazil’s exports have continued to follow an upward trend towards 4.6 million tonnes, primarily as a result of a substantial increase in business with China and, to a lesser extent, Egypt, Iraq, Japan and the United Arab Emirates.
Figure 2. How Brazil has overtaken the USA with poultry exports ('000 tonnes).
According to the USDA further growth is anticipated in Brazil’s broiler exports in 2017 which would push the poultry meat total to around 4.8 million tonnes. In contrast, shipments from the US nosedived in 2015 to below 3.5 million tonnes as a result of the continuation of the Russian embargo but also, and more importantly, the imposition of trade bans related to the outbreaks of highly pathogenic avian influenza in the US, which were widely applied in 2015 and have since continued in several countries. Nevertheless, a recovery of some 3 per cent to 3.6 million tonnes is envisaged for US exports this year, increasing further to 3.8 million tonnes in 2017.
An increase in exports from Europe is forecast for 2016, primarily on the back of higher sales from the European Union, the Ukraine and the Russian Federation.


