

Agricultural Census June 2005 Final Results
NORTHERN IRELAND - The Department of Agriculture and Rural Development has released the final results of the June 2005 agricultural census.
The results provide estimates of crop areas, numbers of livestock and of farmers and workers on active farm businesses on the census date of 1 June 2005.
The main changes between June 2004 and June 2005 are:
Farm businesses: The number of active farm businesses included in the June 2005 census, 27,064, was 550 fewer than in 2004. This is a net change, with some new businesses being created and others merging or ceasing to be active. The downward trend in the number of farms is 2.0% per year over both the past five years and the past ten years.
Crops: There was a 5% decrease in the total area of Cereals between 2004 and 2005. The areas of winter barley and spring barley fell by 11 and 3% respectively. The area of oats decreased by 21% while that of wheat fell by 3%. The area of Potatoes was down by 20% but there were significant increases for other field crops, including arable silage and forage maize.
Cattle: There was little change in the total number of cattle on farms in June 2005 compared with 2004. There were marginally more cows while beef heifers fell by 12%. Cattle for rearing and fattening were down by 1%.
Sheep: The number of ewes fell by 7% when compared with June 2004 and there were 1% fewer lambs.
Pigs: Overall, in June 2005 there were 4% fewer pigs on farms compared with June 2004, with the breeding herd down by 3%.
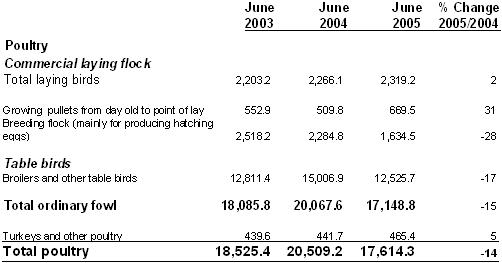
Poultry: Total poultry numbers decreased by 14% since June 2004. This was due, in the main, to a 16% reduction in the number of broilers. The breeding flock decreased by 28%, while laying hens increased by 2%. Farmers and workers: In 2005 there were 2% fewer farmers and business partners, reflecting the change in the number of farms. The total labour force was down by 4%.
Further information from the Agricultural & Horticultural Census is available on the Statistics section of the DARD website where spreadsheets show crop areas, numbers of livestock, farmers and workers and farms for the past 20 years. A new spreadsheet has been added showing the historic trend in the numbers of farms with each of the main enterprises, such as dairy cows or pigs, and the average enterprise size.
Full details of the coverage of the census and of terms used were given in the booklet, ‘The Agricultural Census in Northern Ireland: Results for June 2004’ (DARD, 2004) which is available in full on www.dardni.gov.uk. The 2005 version of this annual publication will be available in hard copy and on that site in January 2006.

Source: Department of Agriculture and Rural Development - 15th November 2005


