

CME: Awaiting WASDE Estimates, Critical to Sector
US - All of US agriculture will be watching closely when USDA releases its monthly Crop Production and Worlds Agricultural Supply and Demand Estimates on May 10, write Steve Meyer and Len Steiner. That report,
of course, will contain USDA’s first estimates of 2012-2013 crop
size, usage and, most critically, year-end stocks for corn, soybeans
wheat and other crops.
Planted acres will most likely come straight from March’s
Planting Intentions report. We know of nothing that officially ties
USDA to those numbers but we also see little that would suggest
they be changed at this point, especially with the slowdown on
planting activity caused by this week’s rains. The number of harvested acres are generally based on historical harvest vs. planted
relationships.
USDA uses various trend relationships for predicted
yields, depending on the crop in question. It also sometimes adjusts those trend yield figures for factors that are already apparent.
For instance, last year’s initial corn yield estimate of 158.7 was
based on the 1990-2010 trend adjusted (downward, we presume
since the May WASDE did not actually say that) for the slow progress of planting that occurred last year. Last year’s soybean yield
was based on the 1989-2010 trend.
Next week’s estimates are critical for U.S. livestock
and poultry producers. That is really nothing new in this postethanol world that routinely sees projected year-end stocks large
enough to support normal usage for only a few weeks. Each year
carries the risk of limited supplies of corn and other grains — and
potentially limited enough to squelch any expansions and, perhaps,
drive contractions.
Before March1, we would have concluded that all of the
four major meat/poultry sectors were poised for growth. The reductions of beef cutouts and fed cattle prices since that time gives us a
bit of pause regarding the beef sector but tight feeder and calf numbers still point to excellent cow-calf returns over the next couple of
years. A good corn crop will push feeder and calf prices higher
relative to fed cattle.
The pork industry was once looking at nearly $20/head
profits for this year. That was February and now in May, those forecast profits are near zero. Lower costs would enhance them, of
course, but the expansion incentives are not huge.
Chicken profits are still modest but, as we pointed out yesterday, the sector is likely to begin growing slowly. Ditto for the
turkey business as profits have been good for two years-plus.
But where might corn and soybean prices end up in
2012-13? The relationship of prices to projected year-end stocks-to
-use ratios is still used by many to derive at least a first estimate of
prices. The nature of those relationships has, of course, changed
with the advent of corn-based ethanol. What were once reasonably
stable relationships for corn and soybeans have shifted dramatically.
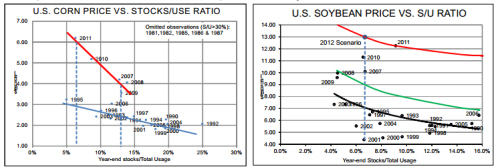
The left chart below shows corn price-s/u ratio pairs from
1990 to 2011. The fundamental change is easily seen. The question is whether the new relationship is the red line that represents
2007-2011 or perhaps just an upward shift of the blue line so it
passes through each year’s observed pair. We think it is the former
and note the $6/bu. price that might occur if last year’s 147.2 bu/
acre yield occurs again and year-end s/u ratio is about 7%. We
also note the roughly $4/bu. price that would result from a 1996-
2011 trend yield of 163.6 bu./acre and a year-end s/u ratio of 13%.
As can be seen in the chart, recent soybean price-s/u
ratio pairs do not form a negatively sloped line. 2006 through 2009
could be represented by the green line but 2010 and 2011 represent higher prices even with higher stock-use ratios. That indicates
stronger demand. A 2012 trend yield of about 43 bu/acre would
result in a roughly 7% s/u ratio next fall and, if the red line is indeed
the new relationship, soybean prices for the 2012-2013 crop year
would average near $13.


