

Ag futures market traders try to gauge coronavirus impact on global economy
The coronavirus outbreak shock to the global marketplace has impacted many markets, including agricultural futures markets. The outbreak has also significantly changed several markets’ near-term technical postures and in some cases altered their longer-term chart postures.By studying the price history of markets over the past decades, or even longer, one can make a strong case that shocks to markets many times cause significant over-reactions among traders, who at first fear the worst outcome and in turn push prices to levels that are ultimately not sustainable and they then correct back to not far from where they were when the shock first hit the markets.
Price action in several markets the past several days, including some ag futures, suggests the coronavirus outbreak event will be factored into most market prices sooner rather than later—and may be already factored in altogether. The sharp to even daily-limit price moves seen in some impacted futures markets recently suggest extreme reactions to a situation that is not yet extreme. Unless the coronavirus situation becomes much more serious, look for the futures market lows in grains, livestock and cotton scored this week, to likely be the lowest of the coronavirus event.
Of course, right now it’s still too early to tell if the markets have indeed fully factored in the coronavirus outbreak and its impact on the global economy. By early next week, traders and investors should have a better idea whether the outbreak has mostly run its course, from a markets-impact perspective.
Importantly, the price action in some key outside markets the past several weeks, including their reactions to the coronavirus shock, has altered their short-term and even in some cases their longer-term technical postures. Such is likely to have some degree of an impact on the agricultural futures markets in the coming weeks, or longer.
Nymex crude oil
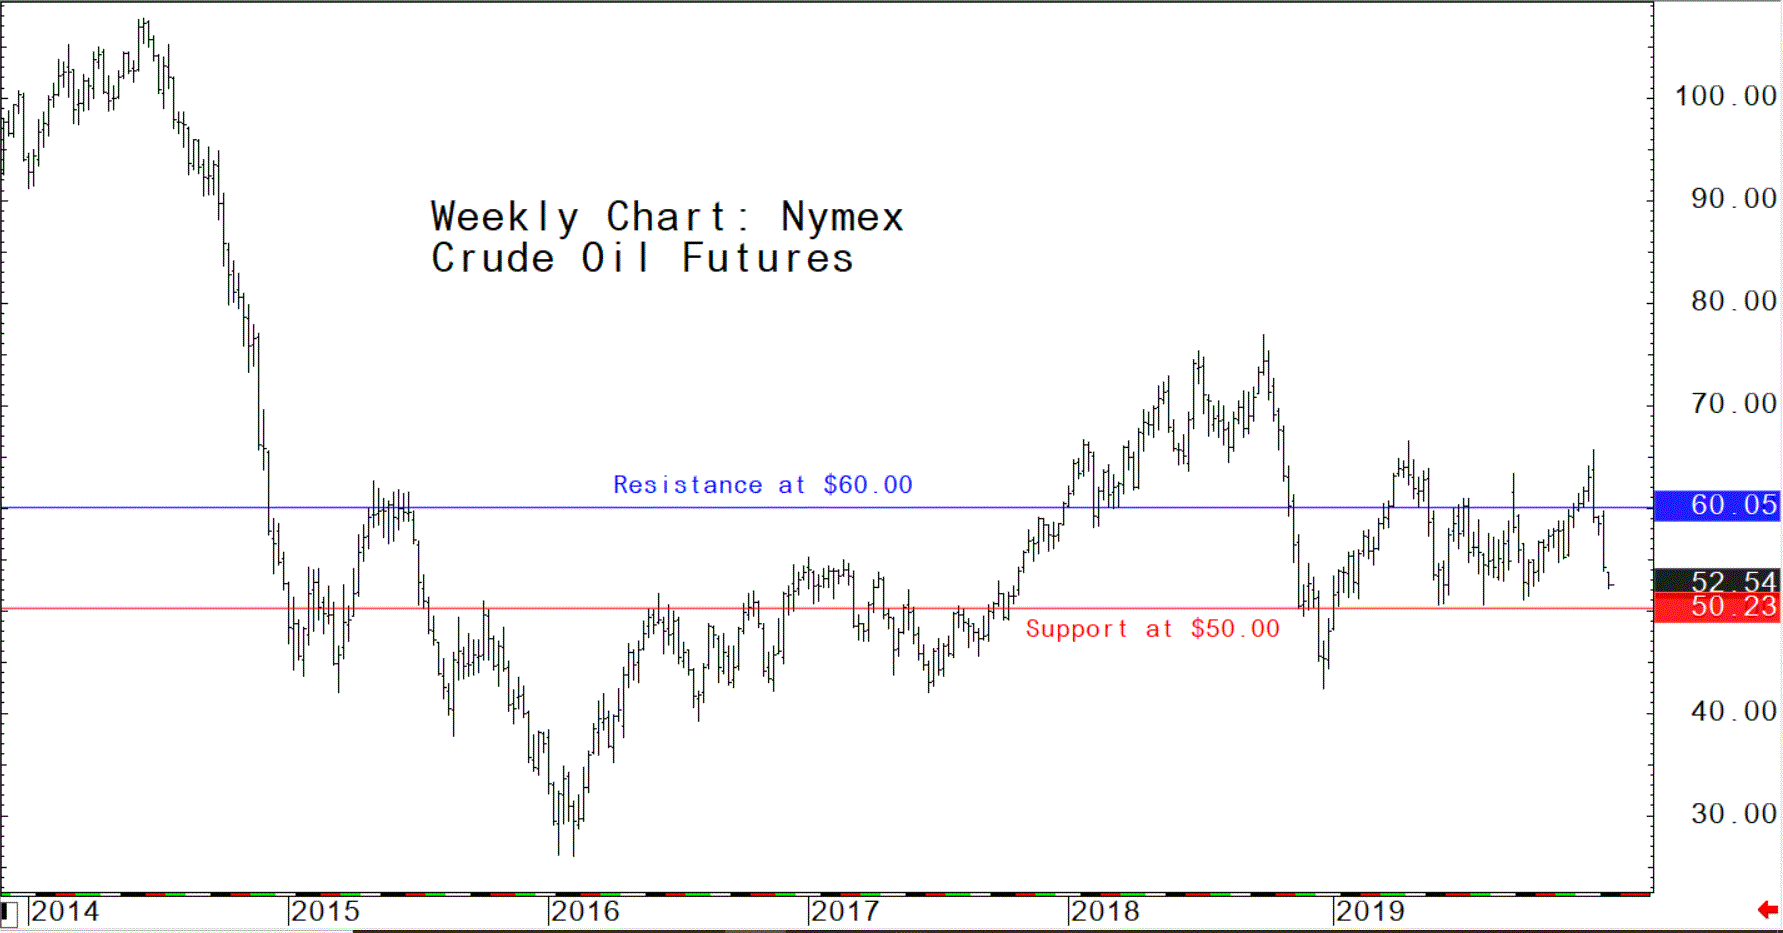
The first week in January nearby crude oil futures prices hit a nine-month high of $65.65 per barrel. Since that spike high prices have backed off to around $53.00 as of this writing. There is strong longer-term technical support around $50.00. Look for the $50.00 level to stop the current price decline—unless the coronavirus turns into something catastrophic that seriously dents global economic growth in 2020. It’s likely that crude oil prices in 2020 will spend most of the time trading between $50.00 and $60.00 a barrel. If that’s the case, crude’s impact on agricultural market prices would be minimal.

© Jim Wyckoff

© Jim Wyckoff
US dollar index
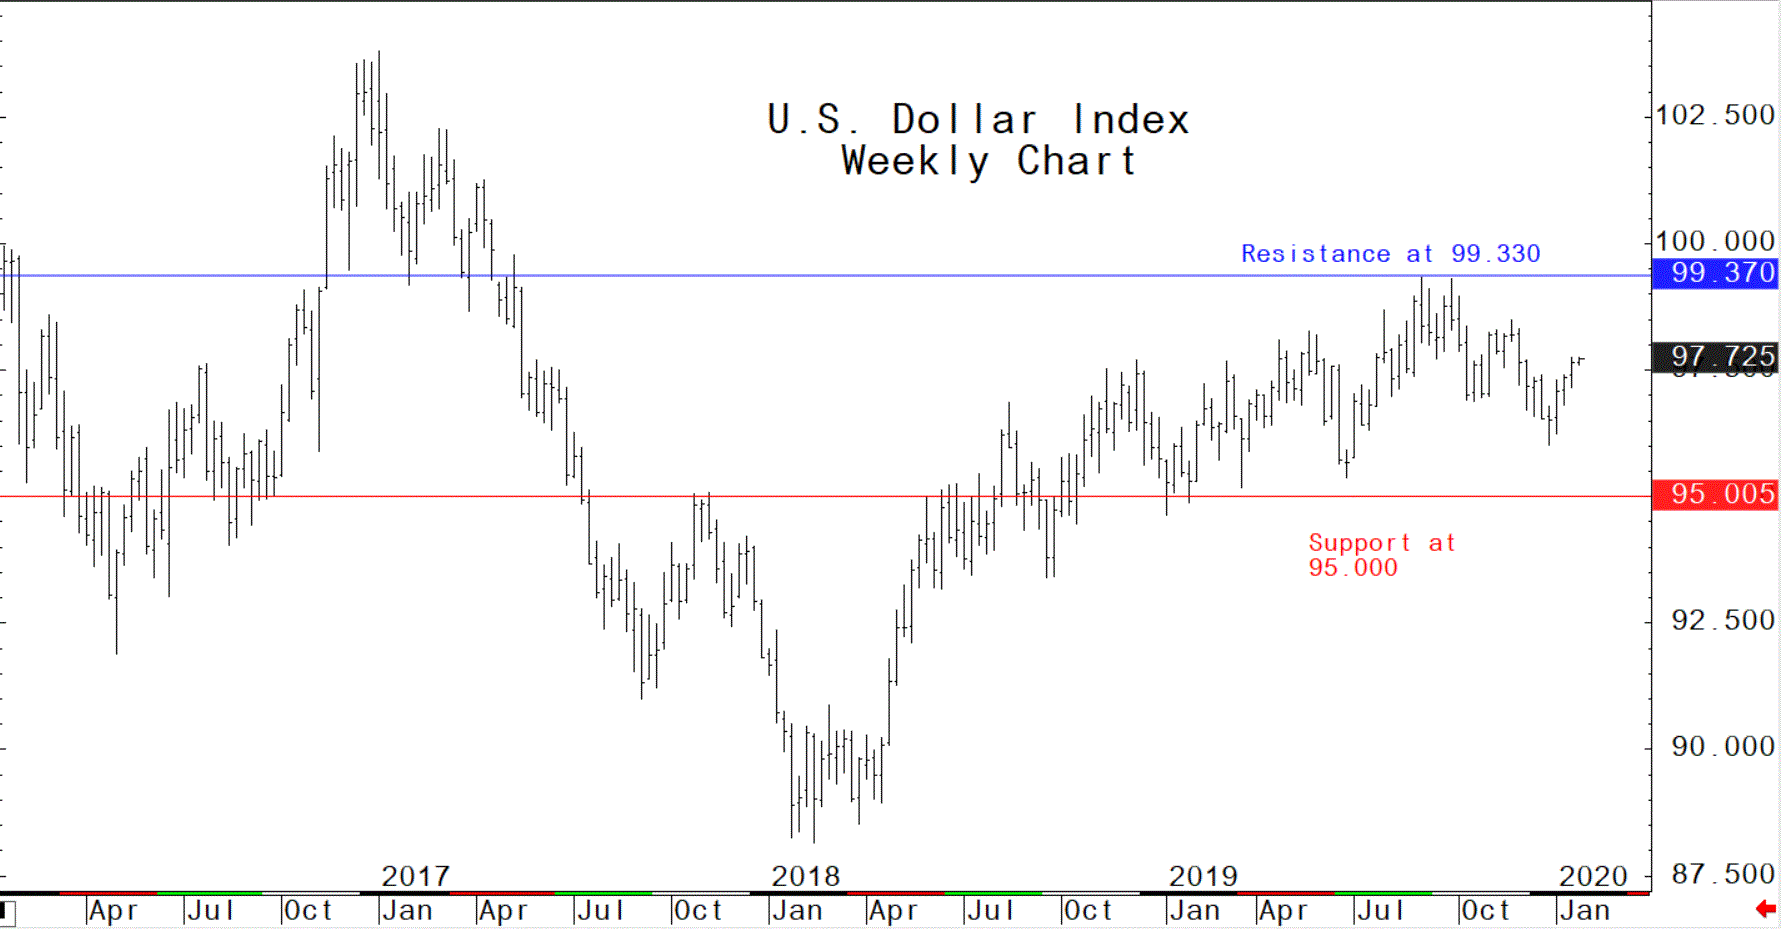
The US dollar index (USDX) is a basket of six major world currencies weighted against the greenback. The weekly continuation chart for nearby USDX futures shows that prices in the last quarter of 2019 were trending down and hitting a six-month low the last week in December. However, in early January the tide turned for the dollar index and prices have been on the upswing since. The US-China partial trade agreement signing was a bullish element, suggesting improved US economic performance in 2020, and now the coronavirus scare is driving safe-haven demand for the US dollar. Still, the weekly chart suggests prices staying in the trading range bound by the support and resistance lines seen on the chart. Further appreciation of the US dollar would be a negative element for US ag commodities, making them more expensive to purchase on the world market, in non-US currency.

© Jim Wyckoff

© Jim Wyckoff
Goldman Sachs Commodity Index
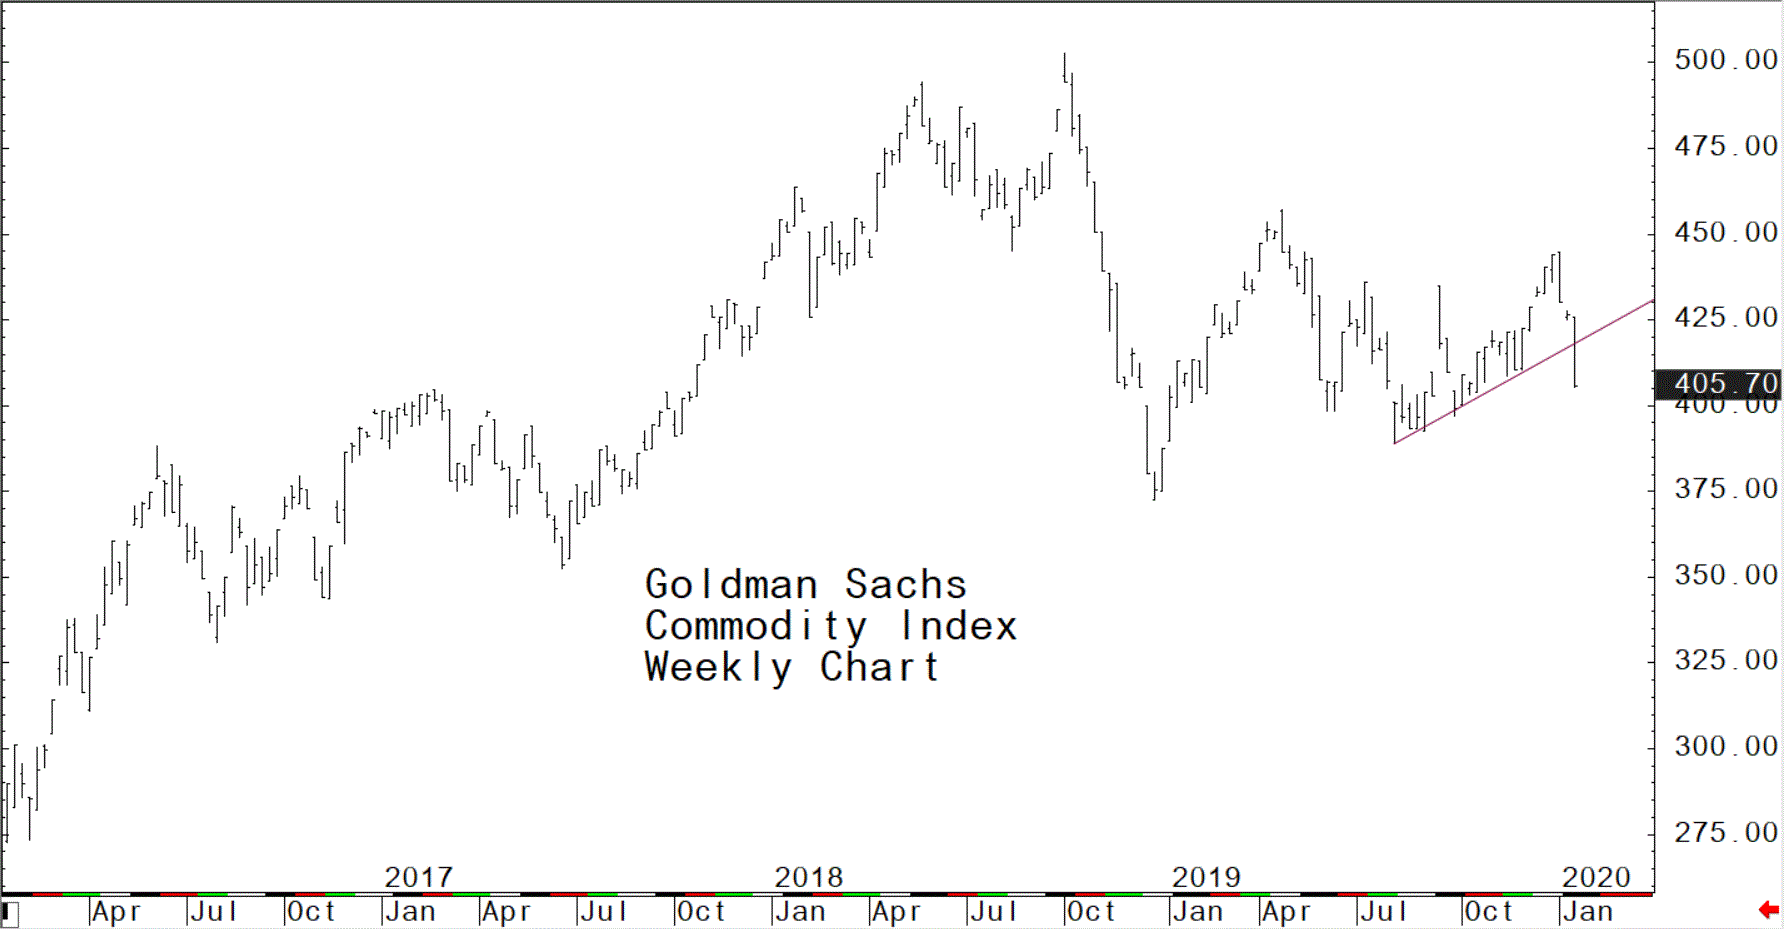
The Goldman Sachs Commodity Index (GSCI) is comprised of several raw commodity futures market prices rolled into one index price. The weekly GSCI chart shows a price uptrend that was in place since last August has now been soundly negated. This has dented bullish enthusiasm in the raw commodity sector. Importantly, the speculative traders, including the big “fund” players, are now going to be much less likely to play the long side of the raw commodity markets—at least for the near term. And it’s the speculators that tend to add the fuel to price uptrends on the charts that turn into big bull market runs, including in ag futures markets.

© Jim Wyckoff

© Jim Wyckoff


