


|
Histopathology and Cytology of
Poultry Diseases By Ivan Dinev, DVM, PhD
|
MYELOCYTOMATOSIS

Fig. 1. Myelocytomatosis (MC) is characterized by proliferation of immature cells from the granulocyte order – myelocytes and promyelocytes. It has an aleukaemic character. Occurs independently or in association with a number of other neoplastic diseases. Atypical morphological forms are possible. Histologically, myelocytomas are easily distinguinshed. Most commonly, they have a perivascular localization. Growth of myelocytes with a relatively high degree of maturity and well formed eosinophilic granules in a liver cross-section. H/E, Bar = 50 µm.
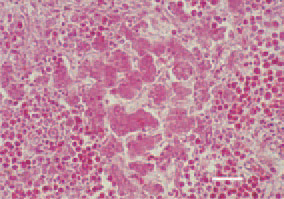
Fig. 2. Atrophic degenerative alterations resulting from compression in a case of intensive myelocyte proliferation in the liver. H/E, Bar = 40 µm.
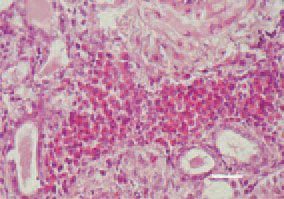
Fig. 3. Focal intertubular myelocyte proliferations in the kidney. H/E, Bar = 25 µm.
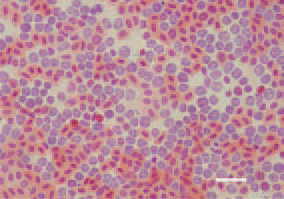
Fig. 4. Numerous myelocytes in the peripheral blood of a guineafowl keet, 95 days after challenge with an ALV-J isolate. H/E, Bar = 10 µm.
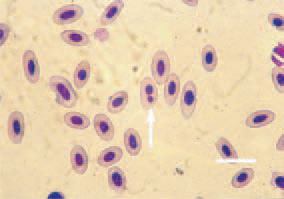
Fig. 5. Blood smear from a hen with myelocytomatosis. A picture of anaemia – anisocytosis, poikilocytosis, two-nucleus erythrocyte (arrow). H/E, Bar = 10 µm.
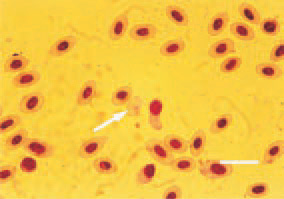
Fig. 6. Blood smear from a hen with myelocytomatosis. A picture of anaemia – anisocytosis, poikilocytosis, erythrocyte without nucleus (arrow). H/E, Bar = 10 µm.
MYELOCYTOMATOSIS - ASSOCIATED NEOPLASMS
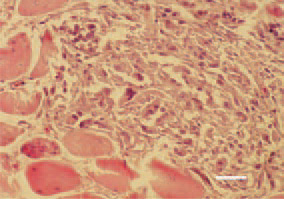
Fig. 7. Rhabdomyosarcoma, pectoral muscle, hen. An extremely high polymorphism of cells constituting tumour parenchyma. H/E, Bar = 25 µm.
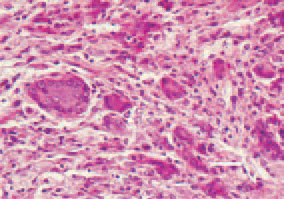
Fig. 8. Rhabdomyosarcoma located in the thigh muscle of a hen. An area with multiple hyperchromatic, polynuclear cells. H/E, Bar = 25 µm.
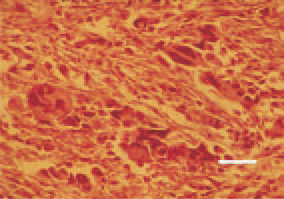
Fig. 9. Leiomyosarcoma, mesosalpinx. Polygonal giant cells with hyperchromatic nuclei. H/E, Bar = 25 µm.
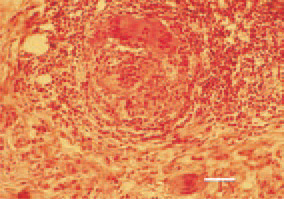
Fig. 10. Leiomyosarcoma, small intestine. Prolongations of polynuclear symplastic elements (arrows). H/E, Bar = 30 µm
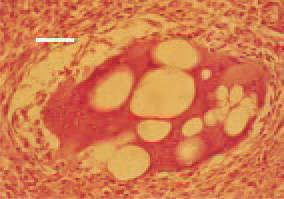
Fig. 11. Leiomyosarcoma, small intestine. Extraordinary (“monstrous”) multinuclear giant cell with intracytoplasmic vacuoles. H/E, Bar = 25 µm.
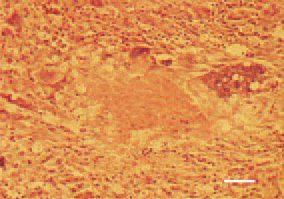
Fig. 12. Degenerative necrobiotic process of a leiomyosarcoma metastasis in the liver of a hen. H/E, Bar = 25 µm.
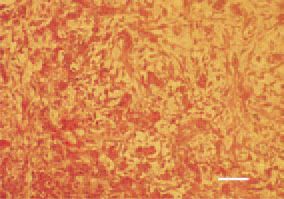
Fig. 13. Myxosarcoma, liver, hen. H/E, Bar = 25 µm.
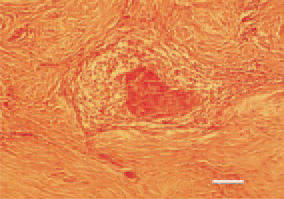
Fig. 14. Fibro-myxosarcoma, metastatic focus in the cervical subcutis from a primary mixed mesenchymal tumour in the alimentary tract. H/E, Bar = 40 µm.
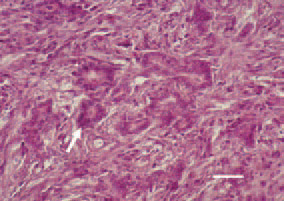
Fig. 15. Carcinosarcoma, pancreas. Tubulous glandular epithelial formations - carcinomatous component (arrow), among the liposarcomatous part of the parenchyma. H/E, Bar = 30 µm.
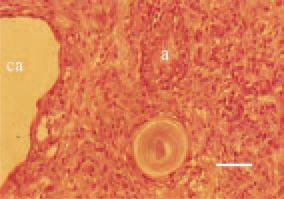
Fig. 16. Carcinosarcoma in the region of the infraorbital sinus. Adeno- (a) and cystadenocarcinomatous (ca) structures among the sarcomatous part of the parenchyma. H/E, Bar = 30 µm.
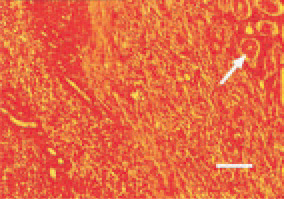
Fig. 17. Nephroblastoma. An area of embryonal-like cells of mesenchymal and epithelial origin. Simultaneous presence of tubules (arrow) at a different stage of development. Young nondifferentiated tubules are not clearly distinguished among the sarcomatous structures. H/E, Bar = 30 µm.
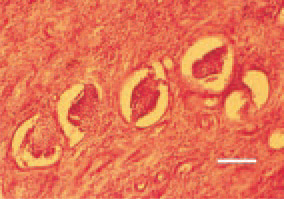
Fig.18. Nephroblastoma. A group of poorly differentiated glomerular structures among the neoplastic tissue of a fibrous type. H/E, Bar = 50 µm.
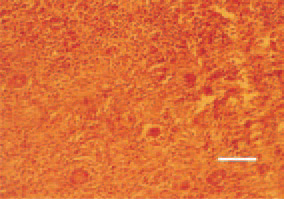
Fig. 19. Nephroblastoma. Young tubules with a rosette-like structure. H/E, Bar = 50 µm.
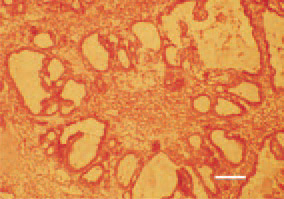
Fig. 20. Kidney, cystadenocarcinoma. H/E, Bar = 35 µm.
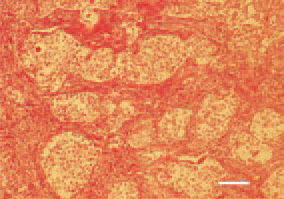
Fig. 21. Ovary, granulosa-theca cell tumour. Islets of anaplastic cells, delineated by well-developed stroma of fibrous and smooth muscle fibres. H/E, Bar = 30 µm.
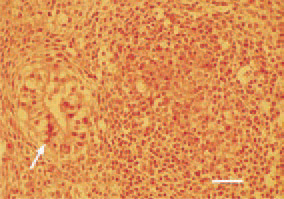
Fig. 22. Ovary, granulosa-theca cell tumour. Tubulus-like formations (arrow) of the tumour parenchyma. H/E, Bar = 25 µm.
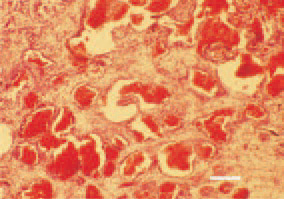
Fig. 23. Haemangiosarcoma of the small intestinal wall. The parenchyma consists of anastomizing canals with papilliferous depressions. H/E, Bar = 50 µm.
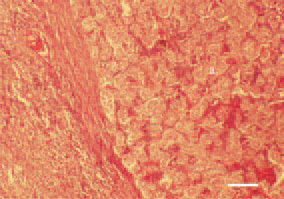
Fig. 24. Liver cell carcinoma. Growth of rosette-like and tubulous structures (a) surrounded by a dense fibrous and well-vascularized capsule. H/E, Bar = 50 µm.
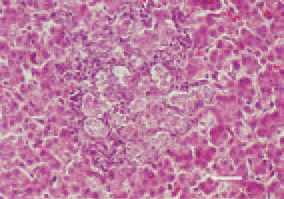
Fig. 25. Cholangioma, liver, hen. Well differentiated structures resembling biliary ducts. H/E, Bar = 35 µm.
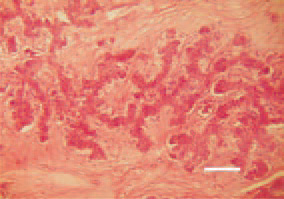
Fig. 26. Intrahepatic cholangiocarcinoma. Irregular glandular papilliferous neoplastic formations. Marked stromal desmoplasia. Fibrous tissue surrounding the neoplastic glands. H/E, Bar = 50 µm.
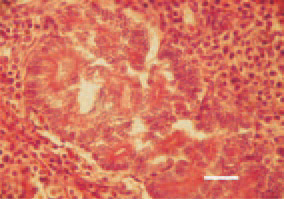
Fig. 27. Extrahepatic cholangiocarcinoma. Glandular epithelial carcinoma to the extrahepatic biliary tract. H/E, Bar = 25 µm.
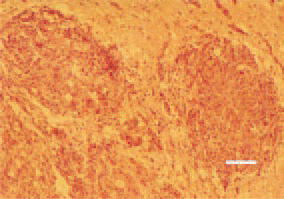
Fig. 28. Glioblastoma, symmetrical neoplastic foci, brain, hen. H/E, Bar = 35 µm.